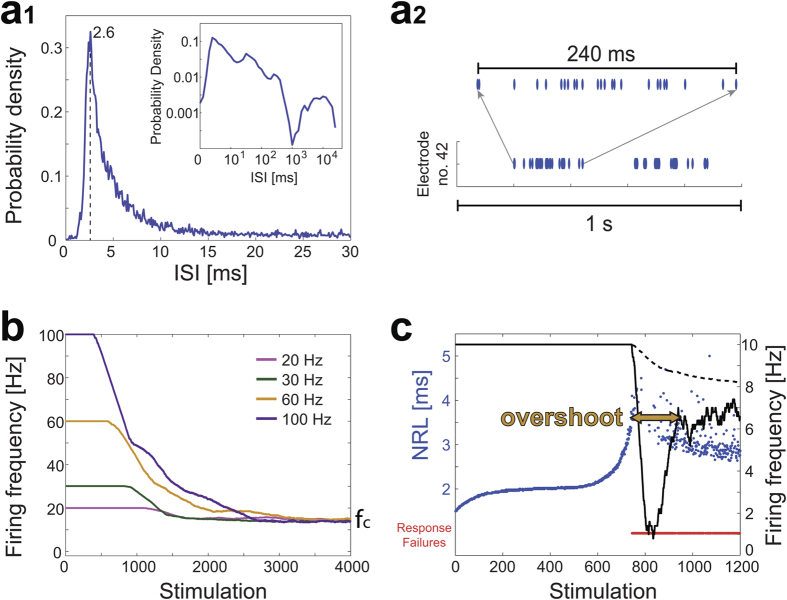
Figure 2. Activity collapses as a result of the neuronal plasticity.
(a1) The probability density of inter-spike-intervals, ISIs, less than 30 ms, of an electrode from Fig. 1b (Methods), and the entire range of the ISIs (inset). (a2) Zoom in of one electrode recording. (b) The firing frequency of a neuron stimulated at 20, 30, 60 and 100 Hz calculated using sliding windows of 500 stimulations, or the maximal available one for stimulations 1 to 500, indicating a maximal firing frequency, fc ~ 17 Hz, independent of the stimulation frequency. (c) Neuronal response latency (NRL) of a neuron stimulated at 10 Hz (blue dots), and its response failures (red dots). The averaged firing frequency calculated using sliding windows of 50 stimulations (black) and the averaged accumulated firing frequency (dashed black line). The overshoot at the transition to the intermittent phase represents a kind of “kick down” mechanism to saturate the firing frequency (Fig. 2b).

