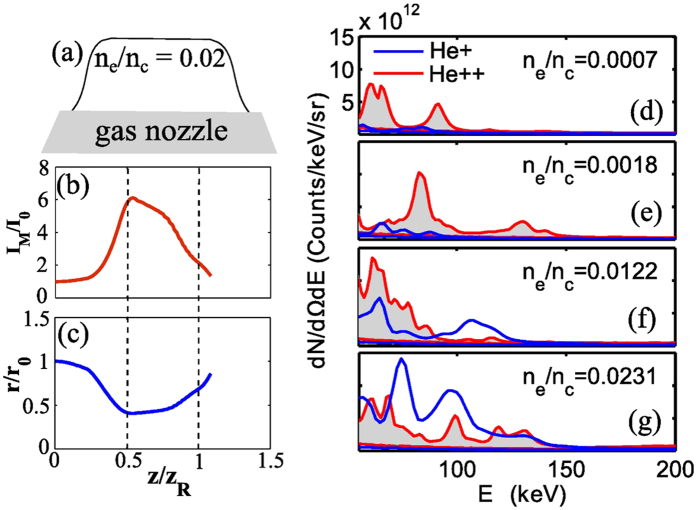
Figure 2.
(a–c) Results of WAKE simulations. (a) Schematic showing longitudinal position of the hypergaussian gas plasma density profile relative to the simulation box. (b) Ratio of vacuum peak intensity I0 and peak intensity inside plasma IM as a function of position z (zR = Rayleigh length). (c) Ratio of laser beam size at the entrance r0 and inside plasma r. (d–g) Experimental measurements, showing variation in observed ion energy distributions of the two ionic species He+ and He++ as density is tuned from extremely underdense to mildly underdense regime. nc is critical density given by  , where ωL, me and e are laser frequency, electron mass and electron charge respectively.

