
Figure 2. Cartoon of real-time observation methods.
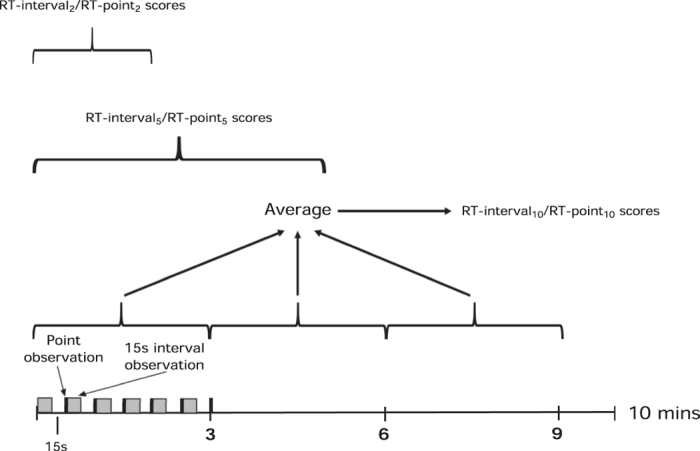
Observations alternate between point and 15 s interval observations. After a 15 s pause, the observations are repeated for the 10-minute observation period. Scores from each 3-minute block were averaged and 3 blocks averaged to give an overall score for the 10 minute period (real-time interval [RT-interval10] and real-time point [RT-point10]). Raw scores were also averaged over 5 (RT-interval5 and RT-point5) and 2 minutes (RT-interval2 and RT-point2).