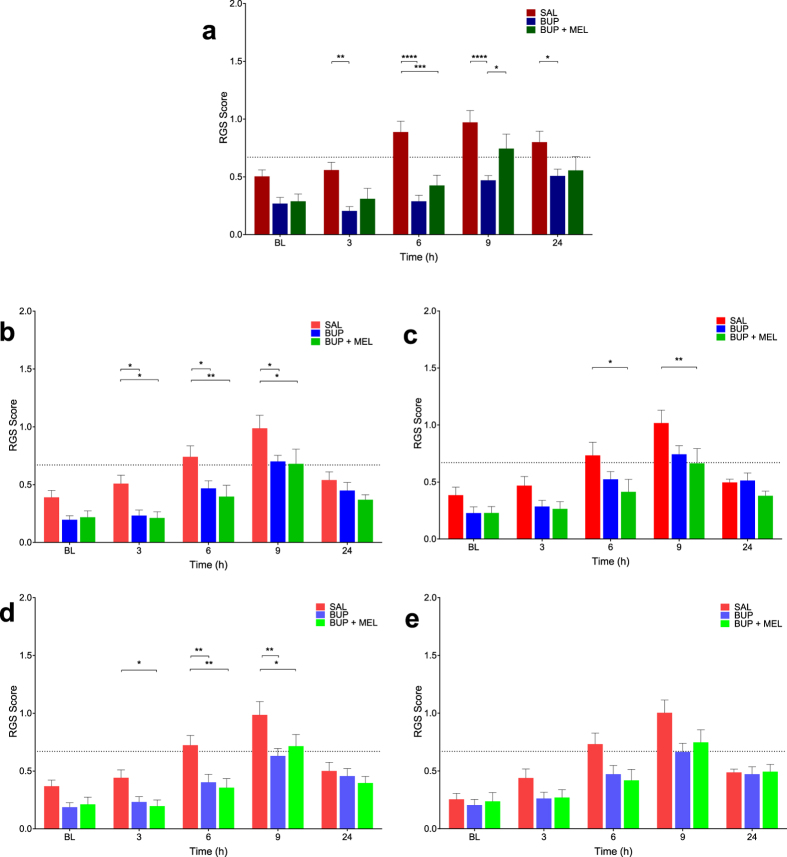
Figure 5. Both standard Rat Grimace Scale (RGS) and real-time interval RGS scoring were able to discriminate between saline and analgesia treatment groups.
(A) Standard (video-based) RGS scoring (IMG-O + V). Lower RGS scores were observed in the buprenorphine treatment group at 3 (p = 0.007), 6 (p < 0.0001), 9 (p < 0.0001) and 24 h (p = 0.03). RGS scores were reduced in the multimodal treatment group at 6 h (p = 0.0003) and a difference was observed between buprenorphine and multimodal treatment groups at 9 h (p = 0.04). (B) Real-time interval observation over 10 minutes (RT-interval10). RGS scores were lower in the buprenorphine group at 3 (p = 0.03), 6 (p = 0.03), and 9 h (p = 0.02). Similarly, multimodal analgesia (buprenorphine and meloxicam) resulted in a decrease in RGS scores at 3 (p = 0.02), 6 (p = 0.004) and 9 h (p = 0.01). (C) The real-time point observation over 10 minutes (RT-point10) identified a treatment effect in the multimodal treatment group at 6 h (p = 0.02) and 9 h (p = 0.007). (D) Real-time interval observation over 5 minutes (RT-interval5) showed that buprenorphine and multimodal analgesia were associated with a decrease in RGS scores at 6 h (buprenorphine, p = 0.005; multimodal, p = 0.001) and 9 h (buprenorphine, p = 0.002; multimodal, p = 0.02). RGS scores were also lower in the multimodal group at 3 hours (p = 0.04). (E) Real-time point observation over 5 minutes (RT-point5) did not identify analgesia treatment effects (p = 0.08). SAL = saline, BUP = buprenorphine, MEL = meloxicam. Data are mean ± SEM. Broken horizontal line represents a previously derived analgesic intervention threshold16.

