
Figure 7. Single real-time point scores (scores 1–5) approximates the expected time course associated with each treatment, but visual inspection of the data reveals substantial variability between scores.
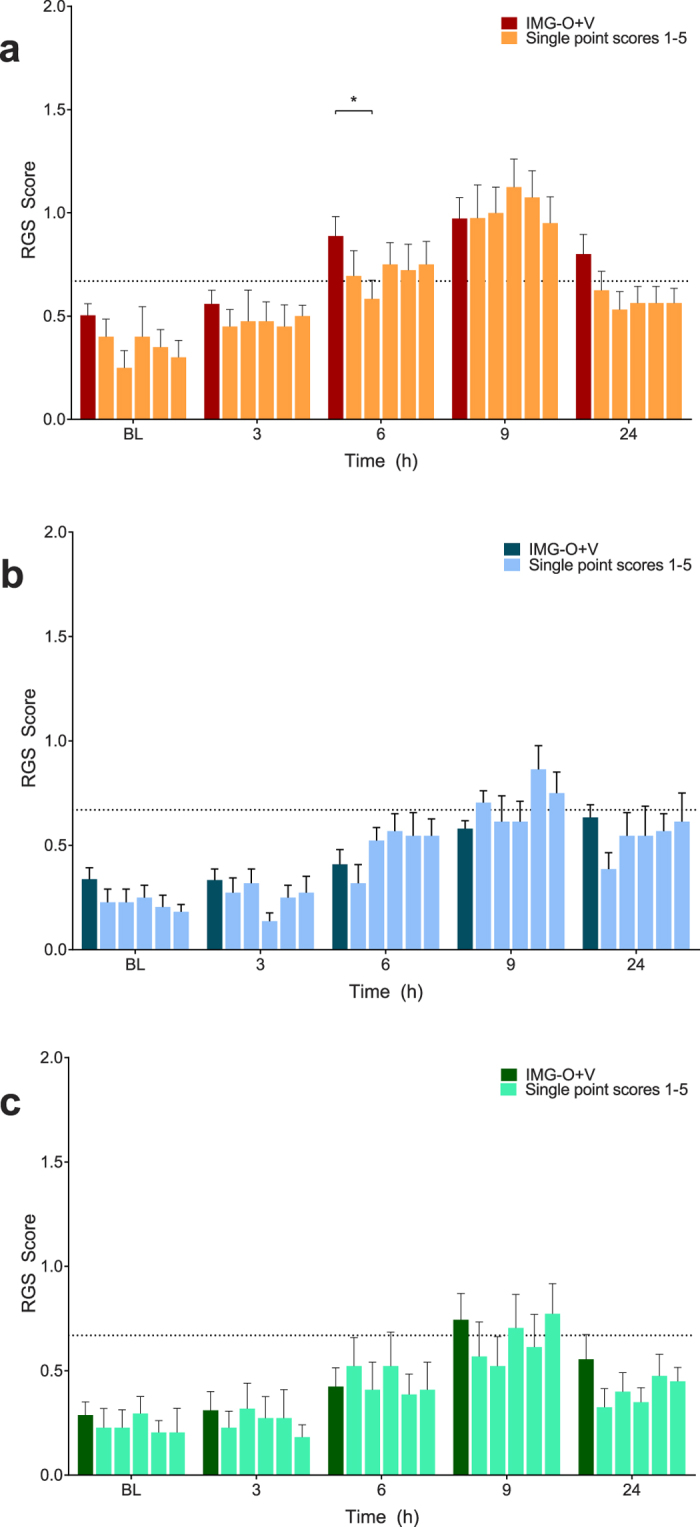
No main effects for scoring method were identified in the buprenorphine ((B) p = 0.13) and multimodal ((C) p = 0.16) treatment groups. A single difference was observed at 6 hours in the saline group ((A) p = 0.03). Data are mean ± SEM. Broken horizontal line represents a previously derived analgesic intervention threshold16.