. 2016 Jun 20;33(8):951–962. doi: 10.1039/c6np00035e

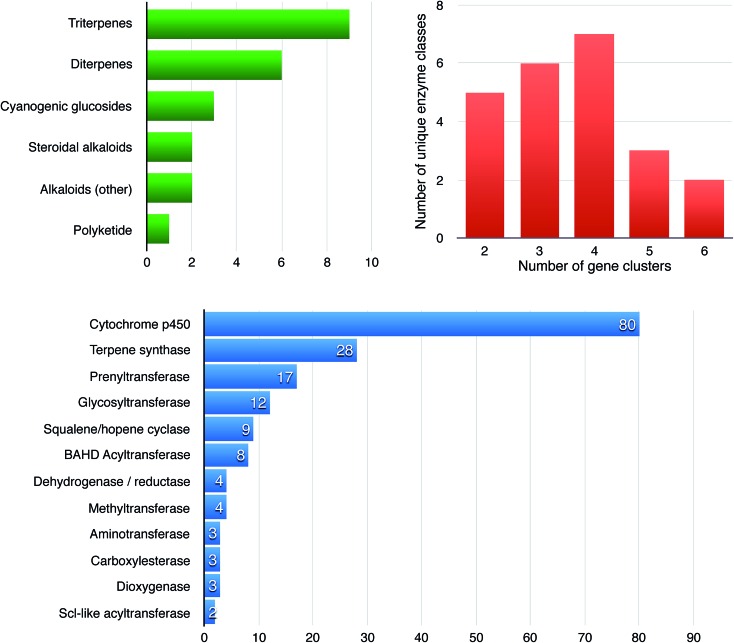
Fig. 2. Features and statistics of 28 known plant biosynthetic gene clusters. The graphs show the distributions of compound classes produced from known enzymes encoded in plant biosynthetic gene clusters (green), the number of unique (broad) enzyme families per gene cluster (red) and the gene counts of enzyme families across all clusters (blue). The numbers for the latter two are based on automated annotation of broad enzyme families through the Pfam database;84 it should therefore be noted that any two enzymes from one Pfam protein family can still catalyze two significantly different chemical reactions. In all specific cases where only two enzyme classes are present in a cluster according to the figure, one of these comprises multiple distinct subclasses of cytochrome P450s belonging to at least two different P450 subfamilies.

Fig. 2