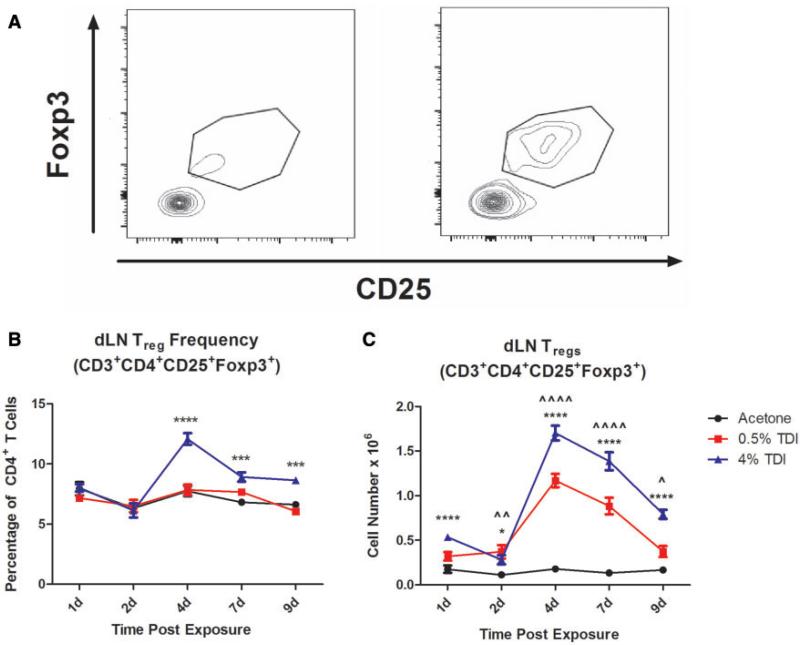
FIG. 2.
Treg subset expands during dermal TDI sensitization. Flow cytometric analysis of Tregs following dermal TDI sensitization (A) Tregs were first gated on their expression of CD3 and CD4, then were further identified by CD25 and Foxp3 expression at indicated time points. dLN Treg frequency (B) and number (C) were determined based on flow cytometry analysis and extrapolation of this data with total dLN cellularity. Graph symbols represent mean (± SE) of 5 mice per group. P-values are represented by (0.5% TDI) and asterisks (4% TDI) (P < .05). Significance is indicated as follows: P ≤ .05 (*), P ≤ .01 (**), P ≤ .001 (***), and P ≤ .0001 (****) for 4% TDI or P ≤ .05 (^), P ≤ .01 ( ), P ≤ .001 (^), and P ≤ .0001 (
 ) for 0.5% TDI. Dermal treatment groups are indicated by the following symbols: circle, acetone; square, 0.5% TDI; and triangle, 4% TDI.

