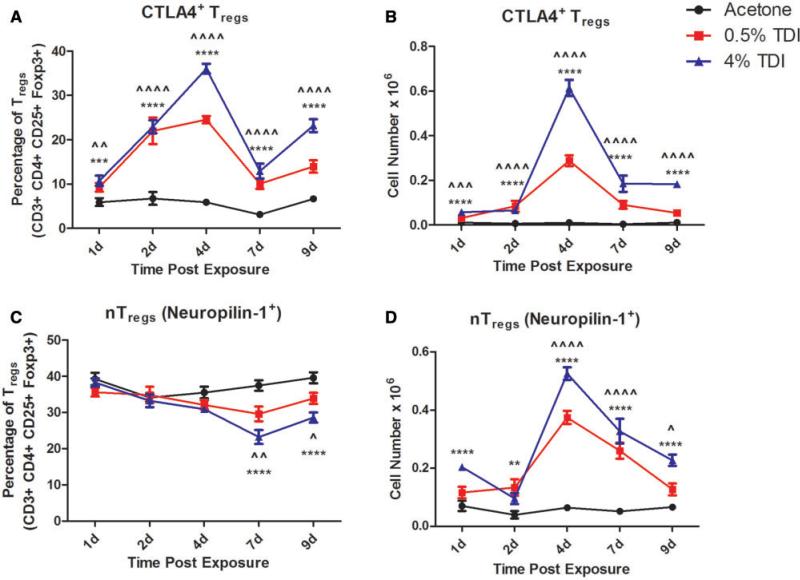
FIG. 3.
Expansion of CTLA4+ and nTreg populations during TDI sensitization. Flow cytometric analysis of dLN CTLA4+ Treg frequency (A) and number (B) and nTreg (Neuropilin-1+) frequency (C) and number (D) following TDI sensitization. Bars represent mean (± SE) of 5 mice per group. P values are represented by (0.5% TDI) and asterisks (4% TDI) (P < 0.05). Significance is indicated as follows: P ≤ .05 (*), P < .01 (**), P ≤ .001 (***), and P ≤ .0001 (****) for 4% TDI or P ≤ .05 (^), P ≤ .01 ( ), P ≤ .001 (
 ), and P ≤ .0001 (
 ) for 0.5% TDI. Dermal treatment groups are indicated by the following symbols: circle, acetone; square, 0.5% TDI; and triangle, 4% TDI.

