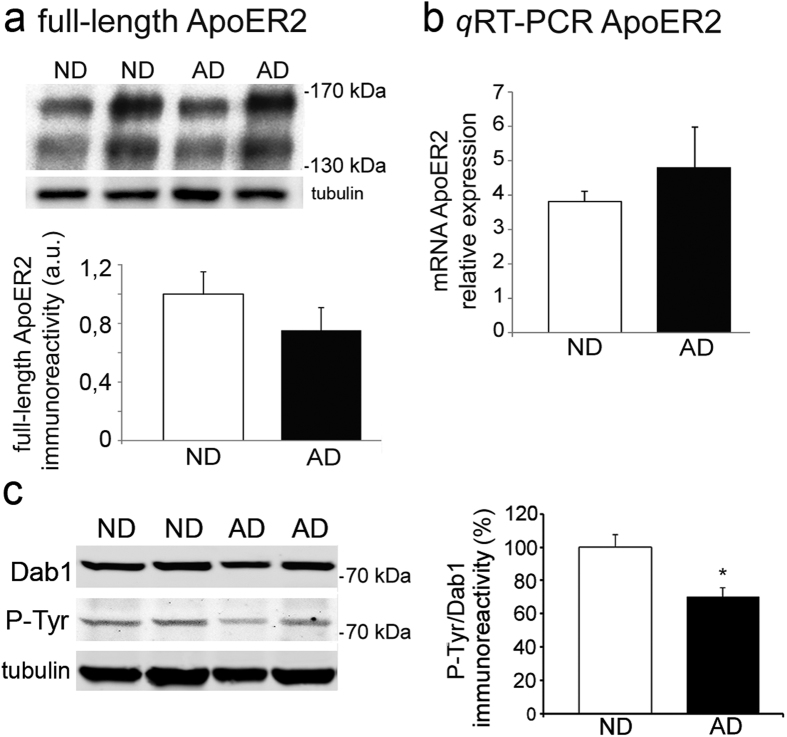
Figure 5. ApoER2 levels remain unaltered in the AD frontal cortex but Dab1 phosphorylation decreases.
(a) Quantification of ApoER2 (~130 kDa + ~170 kDa) in the ND (n = 10) and AD cortex (n = 12) in Western blots probed with a C-terminal ApoER2 antibody and α-tubulin as loading control. (b) Relative ApoER2 mRNA expression analyzed by qRT-PCR in ND (n = 8) and AD (n = 11) frontal cortex, calculated from standard curves and normalized to GAPDH. Data represent the mean ± SEM. None of the comparisons resulted in significant differences, considering the entire AD group or the advanced Braak stages. (c) Western blots of frontal cortex extracts from ND (n = 12) and AD (n = 15) revealed by fluorescence simultaneously for an anti-Dab1 antibody and an anti-phosphotyrosine (P-Tyr), and α-tubulin as loading control. Data represent the means ± SEM and were normalized with respect to the ND values. *p < 0.005 using a Student’s t test.

