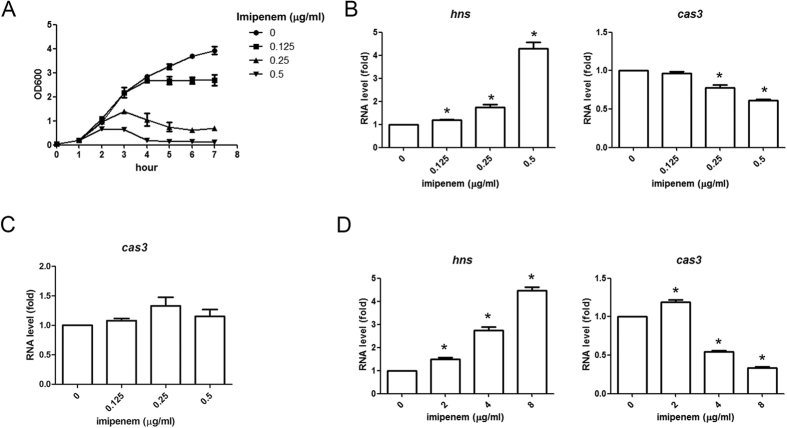
Figure 6. Expression of hns and cas3 under imipenem treatment.
The growth curves of NTUH-K2044 strain under different concentrations of imipenem (Fig. 6A). The RNA levels of hns and cas3 treated with different imipenem concentrations in NTUH-K2044 (Fig. 6B), ∆hns strain (Fig. 6C) and imipenem resistant N308 strain (Fig. 6D). The RNA expressions of hns and cas3 were determined by quantitative RT-PCR after treatment with different concentrations of imipenem for 3 hours; meanwhile the bacterial growth was determined by absorbance measurement under 600 nm. The RNA level without treatment was set as 1, and those with imipenem treatment were calculated accordingly. Data are presented as means ± SEM from three independent experiments. *P-values of <0.05 were considered significant (Student’s t-test).

