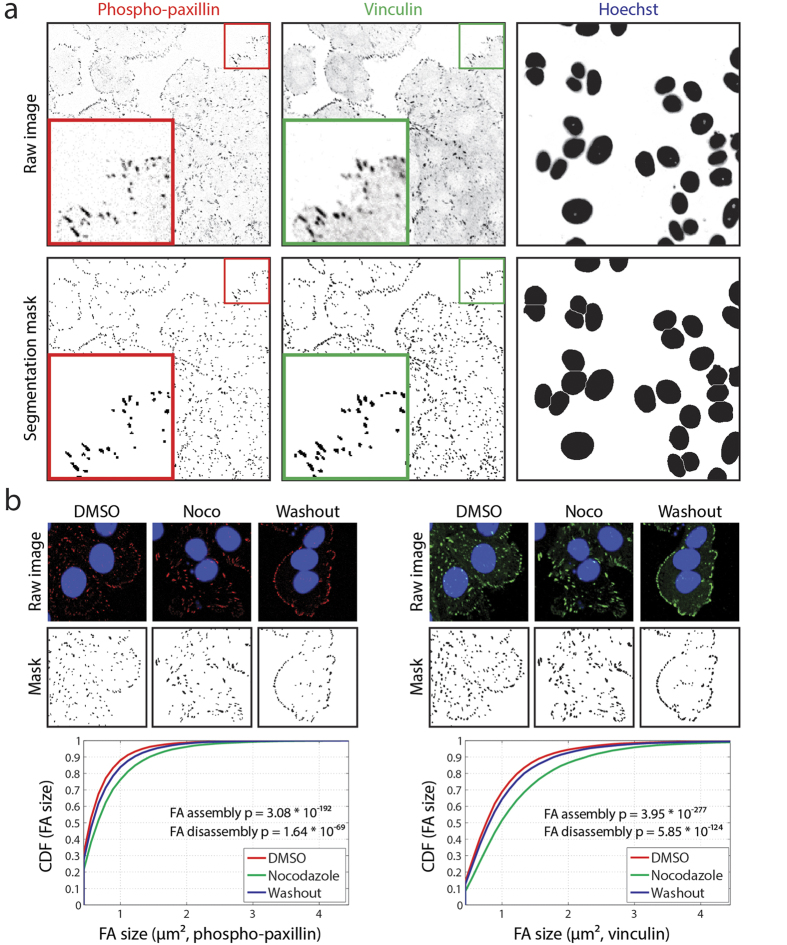
Figure 2. Automated image analysis of focal adhesion morphology allows quantitative assessment of different dynamic states of FAs.
(a) Automated image analysis identifies individual focal adhesions based on pTyr118-paxillin or vinculin staining. (b) Image analysis and quantification of focal adhesion sizes in a set of representative images of the nocodazole assay. Focal adhesion size distribution of nocodazole-induced FA assembly and microtubule-induced FA disassembly were compared using a Kolmogorov-Smirnov (KS) test.

