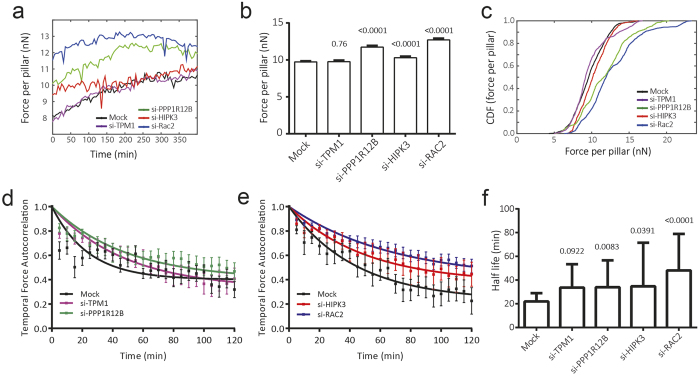
Figure 6. Induced cellular force application and reduced force turnover upon knockdown of PPP1R12B, HIPK3 and RAC2.
(a) Average force per pillar was calculated for each time point and shows constant force application in each condition. (b) Knockdown of PPP1R12B, HIPK3 and RAC2 resulted in significantly higher cellular traction forces, as determined by unpaired t-test with Welch’s correction. Mean ± 95% confidence interval is shown. (c) Distribution of measured cell traction forces. (d,e) Temporal dynamics of force application is plotted as mean ± SEM autocorrelation coefficient of magnitude of forces on individual pillars over time. A non-linear fit of the relationship indicates that autocorrelation of temporal forces is lower in mock transfected cells, compared to knockdown conditions. (f) Halftimes of fitted autocorrelation functions show fast force dynamics in mock-transfected cells, whereas force turnover in knockdown conditions is reduced by approximately 50%. The extra sum of squares F-test was used to compare groups. (a–f) Four independent experiments were performed, with each knockdown tested in two independent experiments. The following number of cells were analyzed for each condition: mock 23 cells; si-TPM1 12 cells; si-PPP1R12B 15 cells; si-HIPK3 7 cells; si-RAC2 19 cells.

