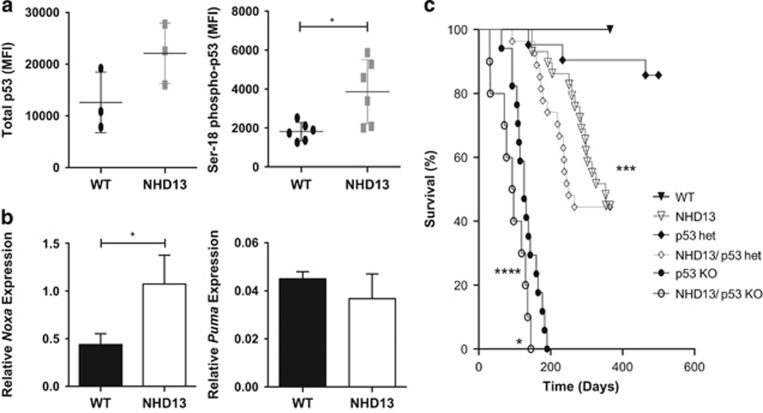
Figure 2.
Expression of p53 and its transcriptional targets; and impact of loss of p53 on NHD13 mouse lifespan. (a) Total p53 and phosphorylated (i.e., activated) Ser18-p53 levels as determined by flow-cytometric analysis in WT and NHD13 MPP cells. Results are expressed as mean fluorescent intensity (MFI); (n=3 per genotype for total p53; and n=6 for phospho-p53). (b) Quantification of Noxa and Puma mRNA levels relative to actin and HPRT (n=3 mice per genotype); error bars represent standard deviation. (c) Kaplan–Meier analysis of animal survival for WT (n=16); NHD13 (n=29); p53−/− (n=17); NHD13/p53+/− (n=27) and NHD13/p53−/− (n=10) mice; *P<0.05; ***P<0.001; ****P<0.0001

