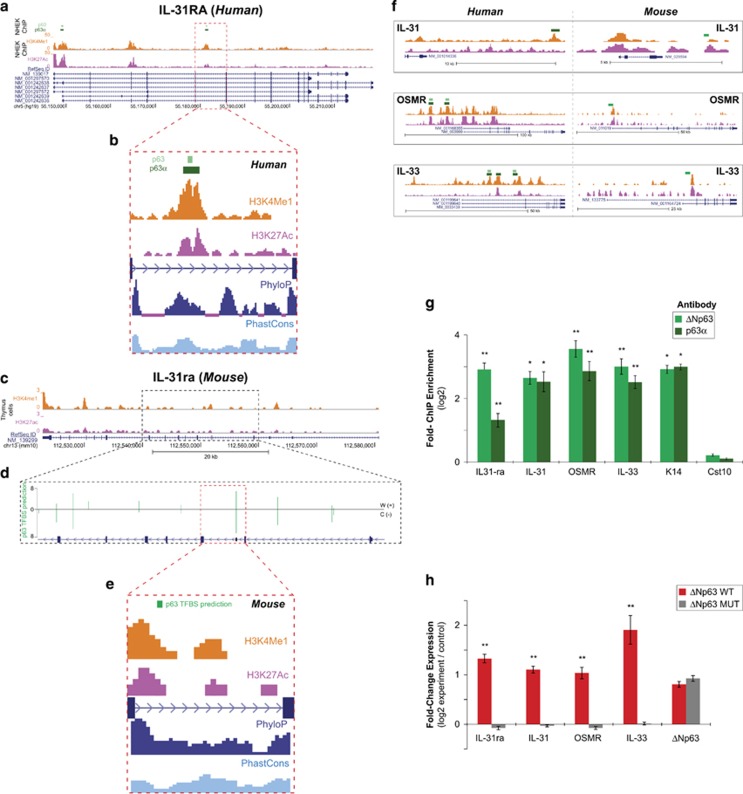
Figure 4.
Direct regulation of IL-31 and IL-33 signaling by ΔNp63. (a) Snapshot of p63 binding at the human IL-31RA locus as demonstrated by ChIP-sequencing (light green=anti-p63, dark green=anti-p63α).45 (b) Histone modifications (orange=H3K4Me1; pink=H3K27Ac) and sequence conservation scores (PhyloP and PhastCons) in NHEK.67 (c) Snapshot of the mouse IL-31ra locus illustrating enrichment of active-chromatin-associated histone modifications.68 (d) The highest scoring-predicted p63 Transcription Factor Binding Sites (TFBS) (see Materials and Methods) is highlighted and magnified. Green bar height indicates predicted p63 binding site scores. (e) Histone marks and sequence conservation for the highest scoring predicted p63-binding site, located between exon 5 and 6 of the mouse IL-31ra gene, which is homologous to the p63-binding site identified in human (4A and 4B). (f) Left, snapshots of p63-binding sites (green boxes, as in panel a) in NHEK cells at IL-31, OSMR and IL-33 gene loci. Right, snapshots of predicted p63-binding sites at mouse IL-31, OSMR and IL-33 gene loci (green boxes). (g) ChIP-qPCR results using the ΔNp63-specific antibody (RR-14) and the p63α (H129) antibody in mouse keratinocytes confirms specific binding of p63 to the IL-31ra, IL-31, OSMR and IL-33 genomic loci at the predicted locations (illustrated in above panels). K14 and Cst10 serve as positive and negative controls, respectively. Values represent mean fold enrichment over random genomic loci±S.E. (h) Quantitative RT-PCR analysis of the mRNA expression levels of IL-33, IL-31, IL-31ra and OSMR in ΔNp63α wild-type or ΔNp63αMUT overexpressing mouse keratinocytes as compared with the control (empty vector). Values were normalized to the housekeeping gene GAPDH. Data are represented as mean±S.E. *P<0.001, **P<0.005, Student's t-test

