Figure 6.
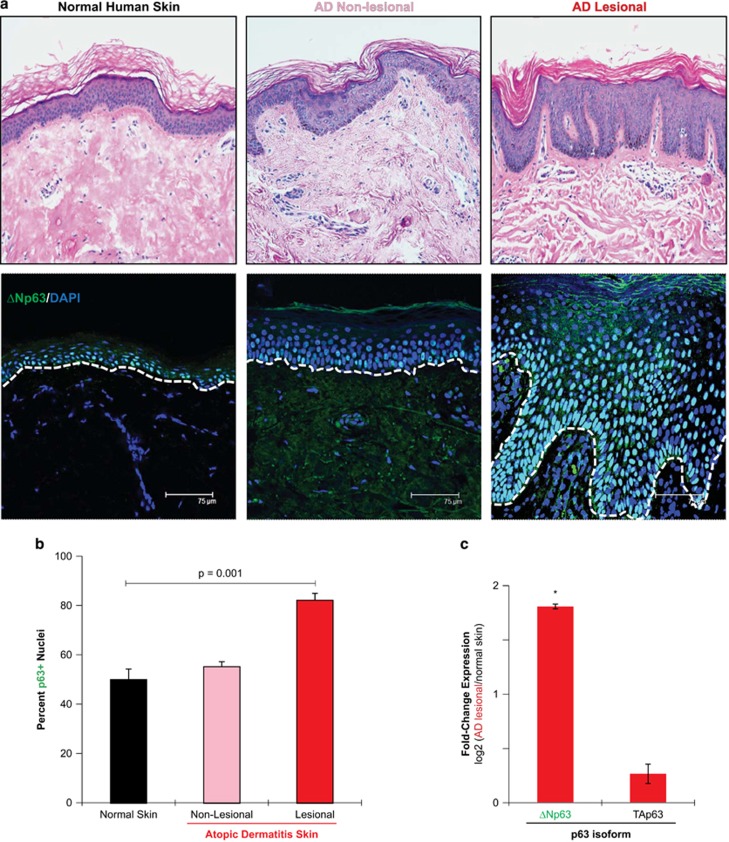
ΔNp63 expression in lesional skin from atopic dermatitis subjects. (a) Upper panel shows hematoxylin and eosin (H&E) staining of normal human skin, AD non-lesional and lesional skin. Lower panel shows representative immunofluorescence staining of ΔNp63 isoform-specific expression in the epidermis of normal skin, AD non-lesional, AD lesional skin. Dotted white lines indicate the epidermal–dermal junction. Scale bar: 75 μm. (b) Quantification of the percentage of ΔNp63+ cells in normal human skin, AD non-lesional and lesional skin is shown. A total of 15 fields of view were used for quantification analysis on normal human skin (n=8), AD non-lesional skin (n=8) and AD lesional (n=8) skin samples. Data are represented as mean±S.D. (c) Quantitative RT-PCR analysis of mRNA expression levels of ΔNp63 and TAp63 in normal skin (n=5) and AD lesional skin (n=5). Values were normalized to the housekeeping gene GAPDH. Data are represented as mean±S.E. *P=0.001, Student's t-test

