Figure 5.
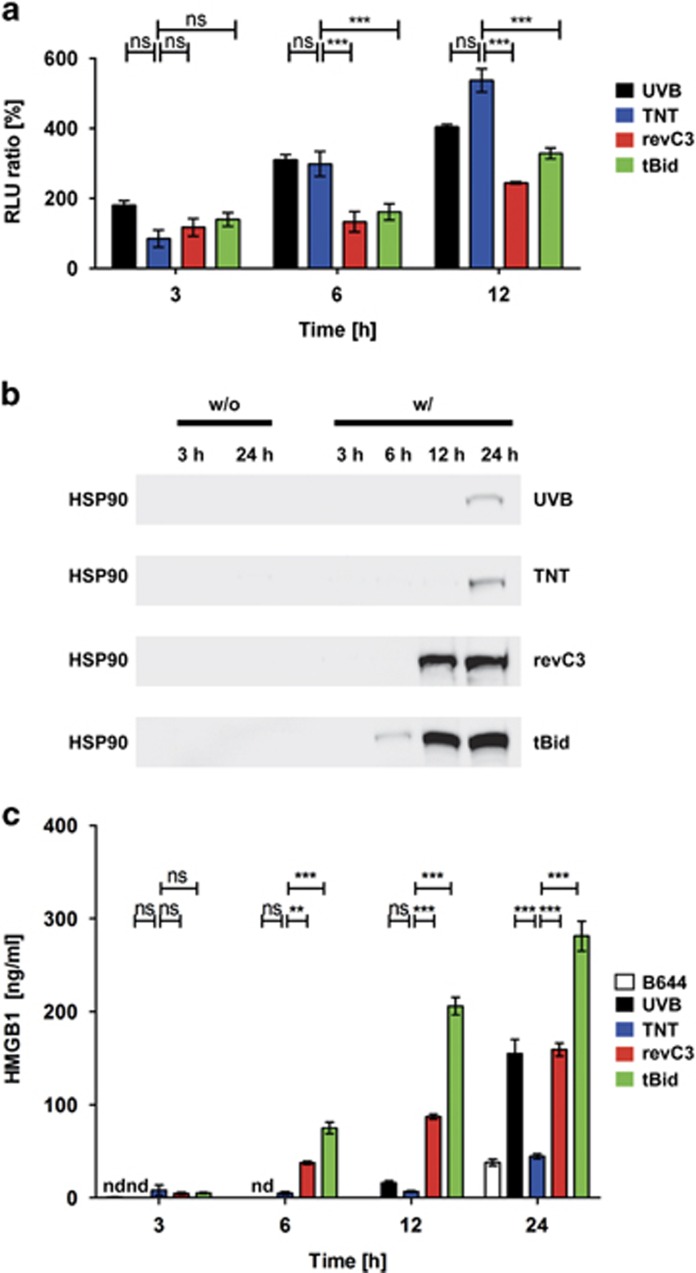
‘Find me' signals and DAMPs released from dying cells. (a) ATP release by dying cells. ATP in the supernatant of dying cells was detected with a luminescence assay. Depicted is the luminescence ratio of cells dying by the respective stimulus and non-stimulated analogous cells (N=4). Shown are means with their standard error of the mean. A two-way ANOVA analysis with Bonferroni correction for multiple comparisons was performed. ** and *** indicate statistical significance with P-values of 0.01 and 0.001, respectively (b) HSP90 release by dying cells. Depicted is the luminescence signal in western blot analysis for the detection of HSP90. Supernatants of cells induced with death stimuli (w/) were analyzed 3, 6, 12 and 24 h after the induction of cell death. Analogous non-induced cells (w/o) served as negative control; (c) HMGB1 release by dying cells. HMGB1 in the supernatant of dying cells was detected with enzyme-linked immunosorbent assay (N=4). Cell supernatants of viable melanoma cells served as negative control (only depicted for 0 and 24 h). Shown are means with their standard error of the mean. ‘ND' indicates non-detectable concentrations of HMGB1. A two-way ANOVA analysis with Bonferroni correction for multiple comparisons was performed. ** and *** indicate statistical significance with P-values of 0.01 and 0.001, respectively; ns, not significant

