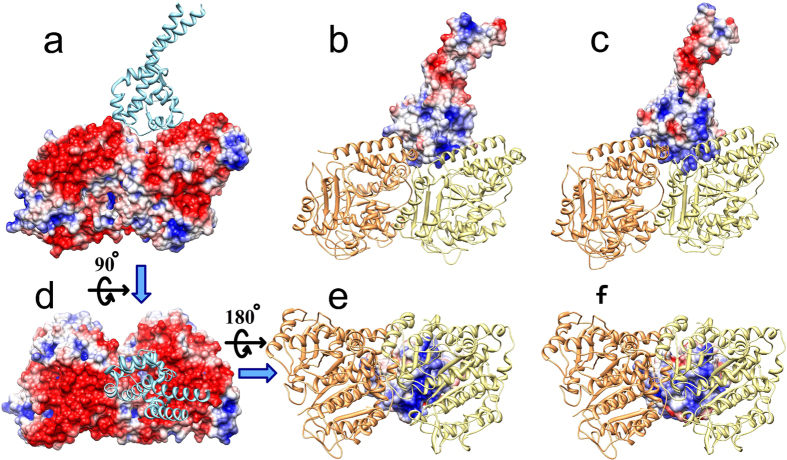
Figure 1. Electrostatic potential mapped onto the MTBD and tubulin dimer.
(a,d) show the side view and the top view of the electrostatic potential distribution on the surface of tubulin, respectively (filled space, red = negative, blue = positive). (b,c) show the side view of the electrostatic potential distribution on the microtubule binding interface of the low- and high-affinity MTBD structures, respectively. (e,f) show the bottom view of the electrostatic potential distribution on the microtubule binding interface of the low- and high-affinity MTBD structures, respectively. In (a,d) the MTBD (cyan ribbon structure) and in (b,c,e,f) the tubulins (α-tubulin, orange ribbon structure and β-tubulin, yellow ribbon structure) are shown for reference, although the potentials are calculated without them.

