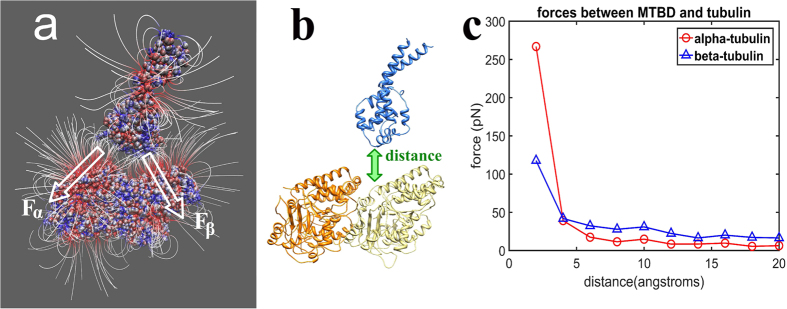
Figure 3. Electrostatic forces between tubulin and the MTBD.
(a) Electrostatic field lines around and between the MTBD and tubulin dimer calculated with the MTBD separated from tubulin by 20 Å. Proteins are shown as space filling, and the red color indicates negative polarity and the blue color indicates positive polarity. The white arrows, Fα and Fβ, indicate the total electrostatic forces between the MTBD and the α- and β-tubulin, respectively. (b) Diagram of the distance between the MTBD (blue) and tubulin (orange and yellow), which is varied from 4 to 20 Å with respect to original crystallographic position of MTBD on microtubule. (c) The magnitude of the electrostatic forces between α-tubulin and the MTBD (circles, red) and β-tubulin and the MTBD (triangles, blue) as a function of the distance between the MTBD the tubulin.

