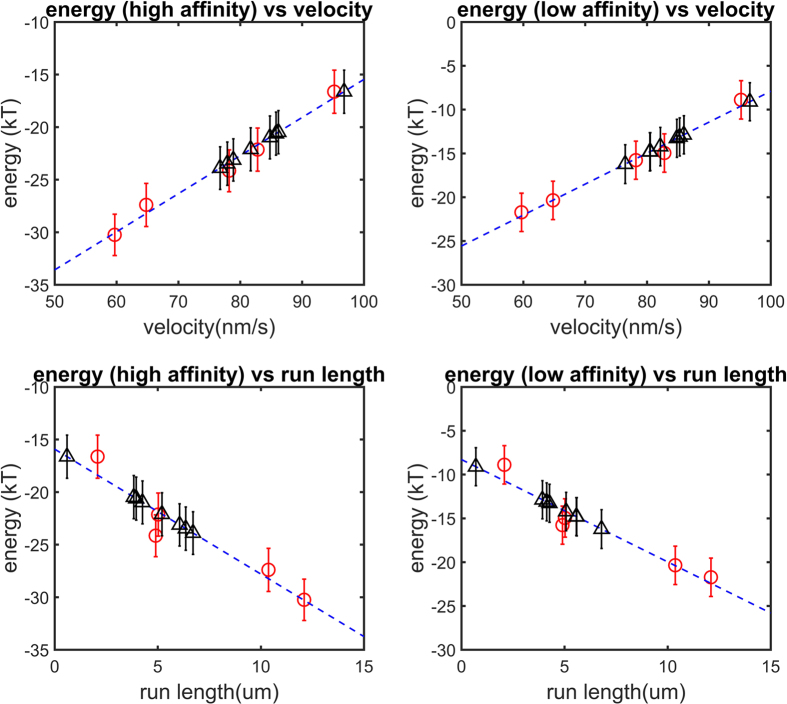
Figure 4. The relationship between electrostatic binding energy and velocity and run length for both high-and low-affinity configurations.
In each panel, the mean calculated electrostatic binding energy is plotted as a function of the mean velocity and run length of the respective mutant (five red circles; n = 50 representative structures; error bars represent the standard error of mean; blue dash line is the least square regression linear fit to the five red circles). Eight additional charged residues were mutated in silico to Ala (Methods), and their corresponding binding energies were calculated and plotted to predict the mean velocity and run length of the respective mutant (black triangles; error bars represent the standard error of mean).

