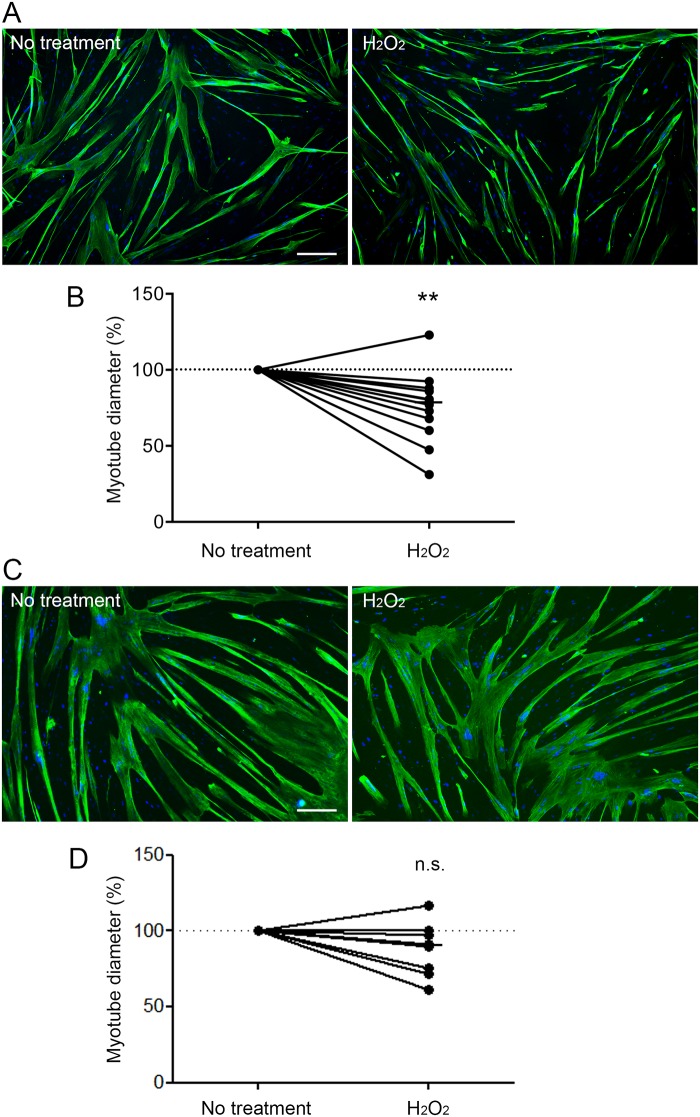
Fig 2. Diameter of COPD and healthy subject myotubes after H2O2 treatment.
Representative images of COPD myotubes (A) or healthy subject myotubes (C) with or without H2O2 treatment, showing fluorescence double-labelling using an anti-troponin T antibody (green) and Hoechst (blue). Bar = 200 μm. Analysis of the variation of the myotube diameter after H2O2 treatment of the COPD myotubes (B) or the healthy subject myotubes (D). (**) indicates statistical significance at P<0.01. (n.s.) indicates statistically non-significant. The medians are indicated.

