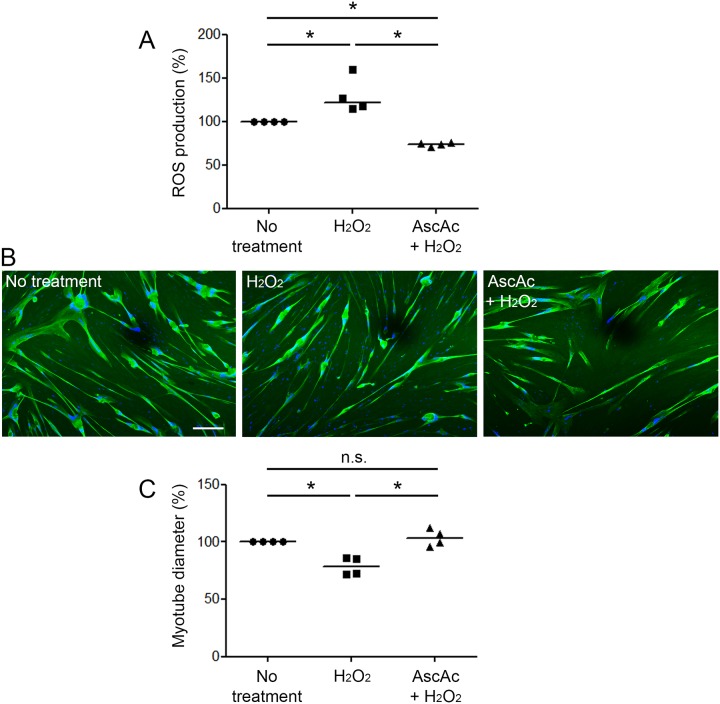
Fig 9. ROS production and COPD myotube diameter after both H2O2 and ascorbic acid treatment.
(A) The variation of ROS production in myotubes derived from 4 COPD patients is shown after H2O2 treatment, and both H2O2 and ascorbic acid treatment. (B) Representative images of COPD myotubes from one patient, in absence of treatment, after H2O2 treatment or after both H2O2 and ascorbic acid treatment, showing fluorescence double-labeling using an anti-troponin T antibody (green) and Hoechst (blue). Bar = 200 μm. (C) Analysis of the variation of the myotube diameter to a reference value of 100after H2O2, and both H2O2 and ascorbic acid treatments. (n.s.) indicates statistically non-significant. (*) indicates statistical significance at P≤0.05. The medians are indicated.

