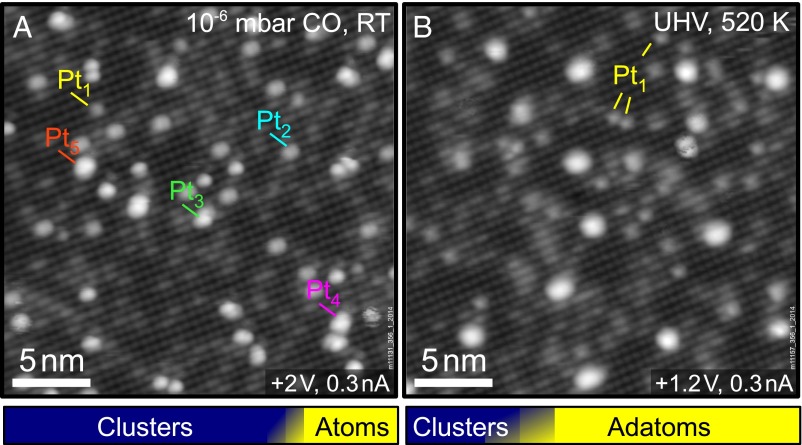
Fig. 4.
Sintering at high CO pressure and redispersion of small clusters by annealing. The bar graphs at the bottom show the average adatom and cluster density in each case. (A) Pt/Fe3O4(001) after exposure to CO pressures up to 10−6 mbar. The main features are small clusters (Pt2, Pt3); the largest observed clusters consist of five atoms. (B) A different region of the sample after annealing to 520 K in UHV. Interestingly, more adatoms are now present at the surface. The number of clusters has decreased and the average cluster size is considerably larger.

