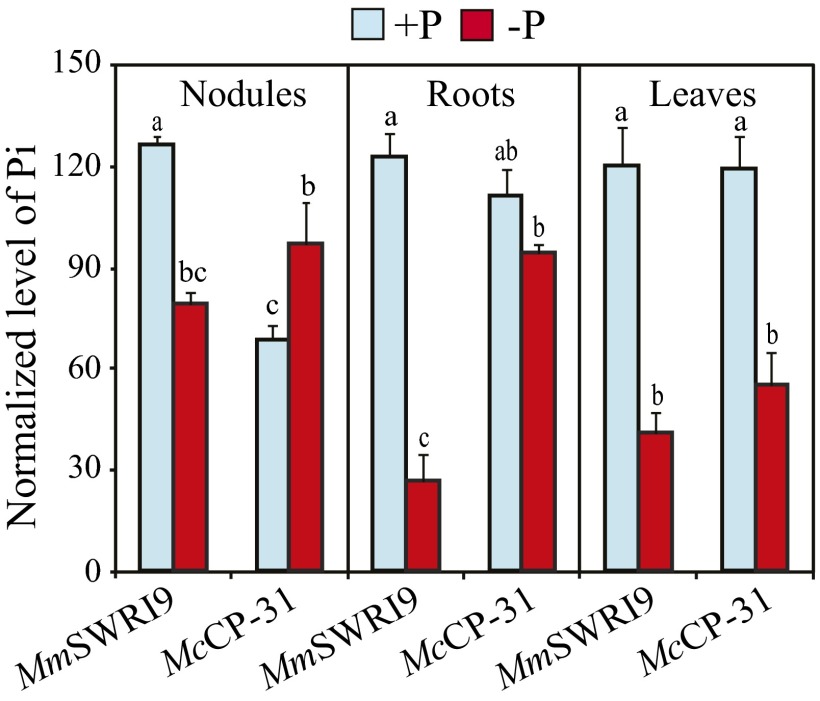
Fig. 2.
Pi levels in nodules, roots, and leaves of chickpea plants. Chickpea seedlings were inoculated with either McCP-31 or MmSWR19 strain and grown over a period of 30 d after sowing under Pi-sufficient (+P) or -deficient (−P) conditions. Relative Pi levels were determined by metabolite analysis. Data presented are the means ± SE of four independent biological replicates. Data with different letters reveal significant differences as measured by a Duncan’s multiple range test (P ≤ 0.05).

