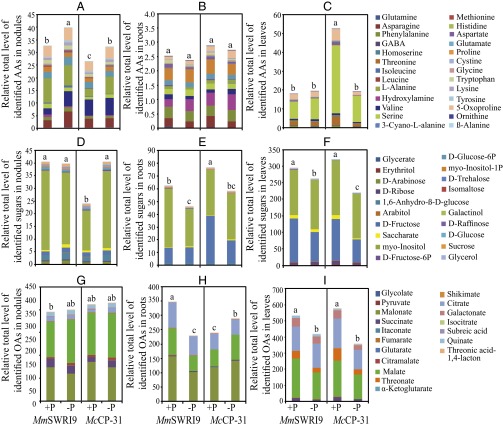
Fig. 5.
Total levels of identified amino acids (AAs) in nodules (A), roots (B), and leaves (C); total levels of identified sugars in nodules (D), roots (E), and leaves (F); and total levels of identified organic acids (OAs) in nodules (G), roots (H), and leaves (I) of chickpea plants. Chickpea seedlings were inoculated with either McCP-31 or MmSWR19 strain and grown under Pi-sufficient (+P) or -deficient (−P) conditions. Data presented are the means of four independent biological replicates. The SE values for each metabolite are shown in Datasets S2–S4. Data with different letters reveal significant differences as measured by a Duncan’s multiple range test (P ≤ 0.05).

