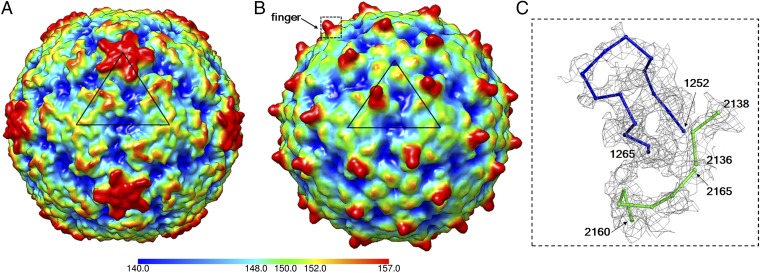
Fig. 1.
The spiky structure of RV-C15a. A 10-Å resolution density map of RV-B14 (PDB ID code 4RHV) (A) and RV-C15a (B) calculated based on the respective coordinates is colored by radial distance (Å) to the virus center. A black triangle indicates an icosahedral asymmetric unit on each of the two viruses. A rectangle (black dashed line) outlines the limit of a close up view of a “finger” in C. Residues that form the finger region, which are fitted into the EM map densities (gray), are shown as Cα backbones and colored blue (VP1 residues) and green (VP2 residues).

