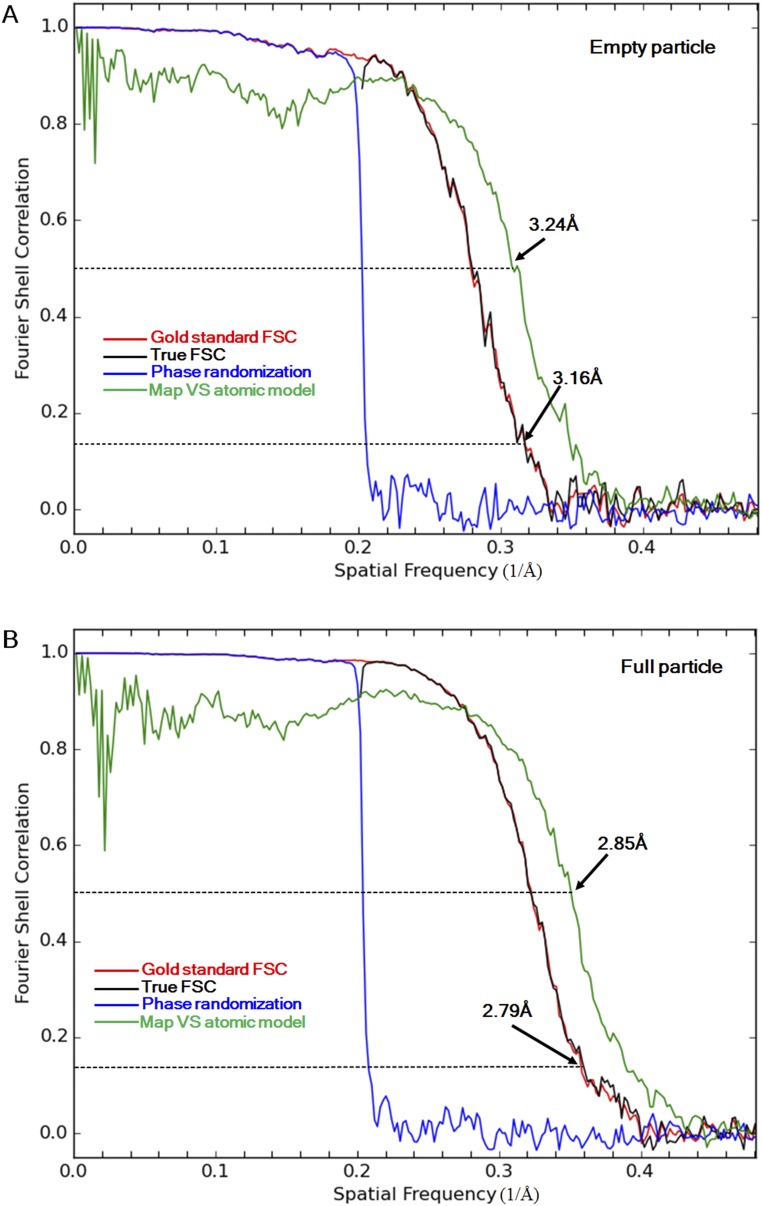
Fig. S4.
The resolution of the empty (A) and full (B) particle maps is estimated using FSC curves. The FSC curves between two half-subset maps calculated using the original images (gold standard FSC) and using phase randomized (beyond 5 Å) images (phase randomization) are colored red and blue. “True” FSC curves are colored black. The FSC curves between the final EM map and a density map computed based on the modeled atomic coordinates are colored green.

