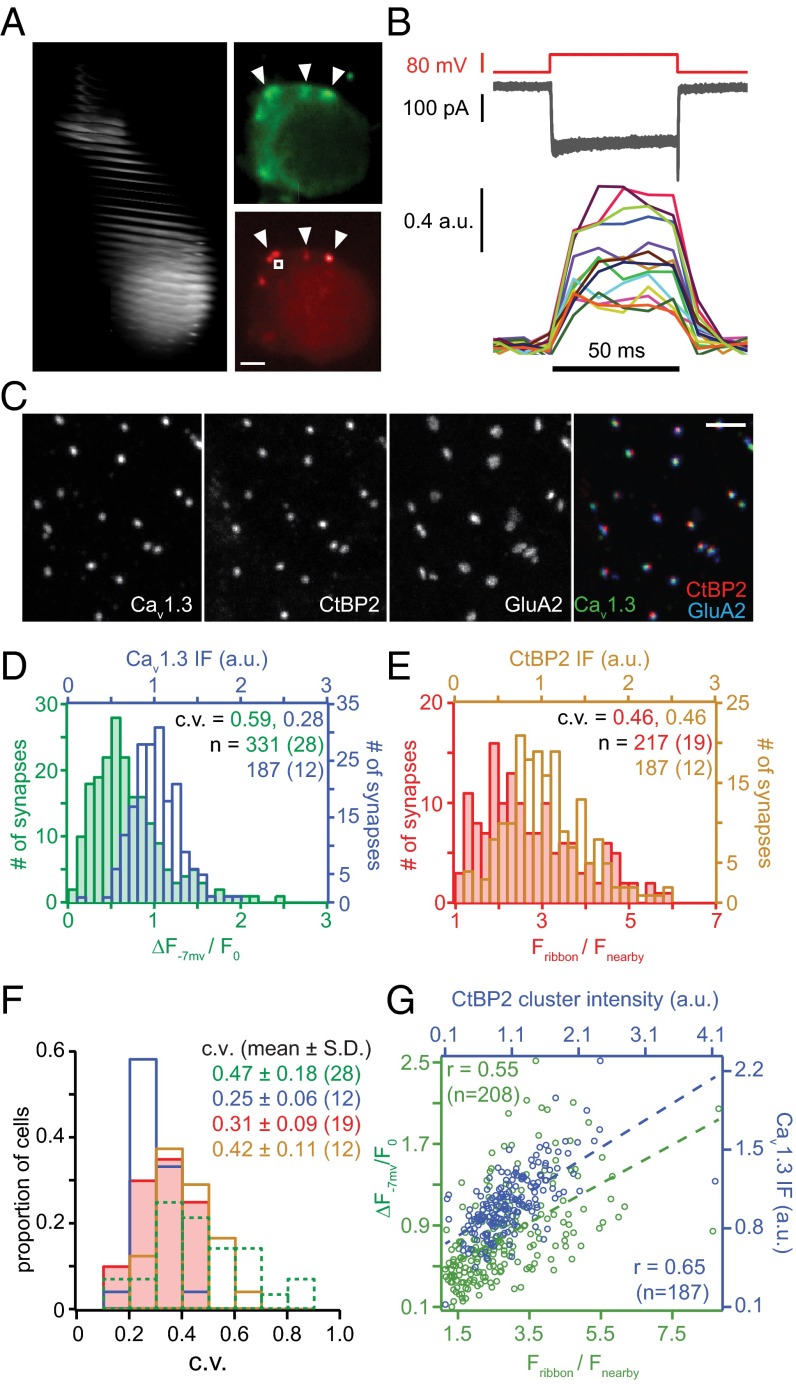
Fig. 1.
AZ heterogeneity: Those with larger ribbons have more Ca2+ channels. (A, Left) Stack of confocal sections covering an exemplary IHC filled with TAMRA-RIBEYE-binding peptide via the patch pipette. (A, Upper Right) Fluo-8FF fluorescence reports Ca2+ influx (arrowheads) as spot-like maxima near the membrane during depolarization. (A, Lower Right) Corresponding image of TAMRA-RIBEYE-binding peptide fluorescence labeling synaptic ribbons (arrowheads), where Ca2+ influx occurs. White square indicates where the background fluorescence (Fnearby) was measured. (Scale bar: 1 µm.) (B) Measurement of Ca2+ influx at individual AZs in an exemplary IHC. Depolarizations to −7 mV (Upper) evoked similar whole-cell Ca2+ currents with each stimulus (superimposed, Middle). Focusing on single AZs during each repetition revealed major heterogeneity of maximal Ca2+-indicator fluorescence amplitudes (Lower, ΔF−7 mV/F0, 100-Hz frame rate; panel superimposes one trace per AZ, each marked by a different color). (C) Confocal projections of immunolabeled presynaptic Ca2+ channels (Cav1.3), presynaptic ribbons (CtBP2/RIBEYE), and postsynaptic AMPA receptors (GluA2) with overlay on far right. (Scale bar: 2 µm.) (D) Green: distribution of the maximal ΔF−7 mV/F0 for each AZ from live imaging. Blue: distribution of the integrated Cav1.3 immunofluorescence pixel intensities for each AZ in fixed tissue. (E) Red: distribution of the maximal fluorescence intensity of TAMRA-peptide labeled ribbons, normalized to the cytosolic fluorescence (Fribbon/Fnearby). Brown: distribution of the integrated CtBP2/RIBEYE immunofluorescence pixel intensites for each AZ. (F) Distributions of the c.v. estimated within individual IHCs for AZ parameters: maximal Ca2+ influx (ΔF−7 mV/F0, dashed green), TAMRA-RIBEYE-binding peptide fluorescence (solid red), Cav1.3 immunofluorescence (solid blue), and CtBP2/RIBEYE immunofluorescence (solid brown). (G) Scatter plot of maximal ΔF−7 mV/F0 vs. TAMRA-RIBEYE-binding fluorescence intensity (green) and of Cav1.3 vs. CtBP2/RIBEYE immunofluorescence (blue). Dashed lines are linear regressions and r is Pearson’s correlation coefficient.

