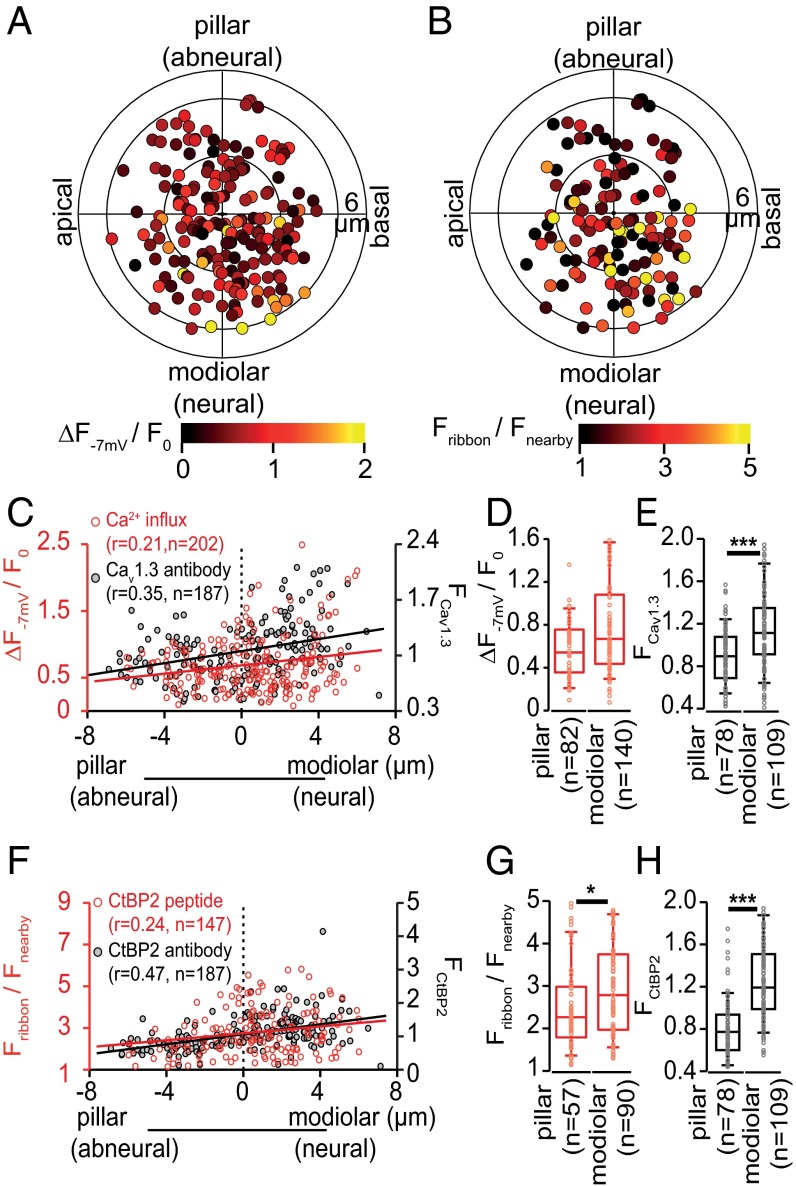
Fig. 2.
Maximal synaptic Ca2+ influx varies with AZ position in IHCs: modiolar–pillar gradient. (A) The polar chart displays intensity of maximal AZ Ca2+ influx (ΔF−7 mV/F0) as a function of AZ position in live-imaging experiments. Modiolar and pillar refer to facing toward or away from the ganglion in the modiolus; apical and basal refer to the tonotopic axis of the organ of Corti. The radius of the inner circle is 3 µm. Data were pooled from 21 IHCs. (B) The polar chart displays locations and intensity of AZ TAMRA-peptide fluorescence intensity in live-imaging experiments. Data were pooled from 14 IHCs. (C) Maximal AZ Ca2+ influx (red, 202 AZs of 21 cells) and integrated AZ Cav1.3 immunofluorescence (black, 187 AZs of 12 cells) as a function of position along the modiolar–pillar axis. Solid lines represent linear regressions and r indicates the Pearson’s correlation coefficient. (D) The box plot (10, 25, 50, 75, and 90% percentiles) shows the statistics of maximal AZ Ca2+ influx for the modiolar (140 AZs) and pillar (82 Azs) halves of the same IHCs as in A. No significant difference was reported by Wilcoxon rank sum test (P = 0.33). (E) The box plot shows the statistics (as in D) of Cav1.3 immunofluorescence intensity for AZs of 12 cells, which was stronger on the modiolar (109 AZs) than on the pillar side (78 AZs, P < 0.001). (F) Spatial gradient of AZ TAMRA-peptide fluorescence in live-imaging (red, 14 IHCs) and CtBP2/RIBEYE immunofluorescence (black circle, same AZs as in E) along the modiolar–pillar axis. (G and H) The box plot shows the statistics (as in D) of the TAMRA-peptide fluorescence intensity (G) and CtBP2/RIBEYE immunofluorescence intensity (H). Both measures indicate greater CtBP2/RIBEYE abundance on the modiolar side than on the pillar side: G, P < 0.05 and H, P < 0.001.

