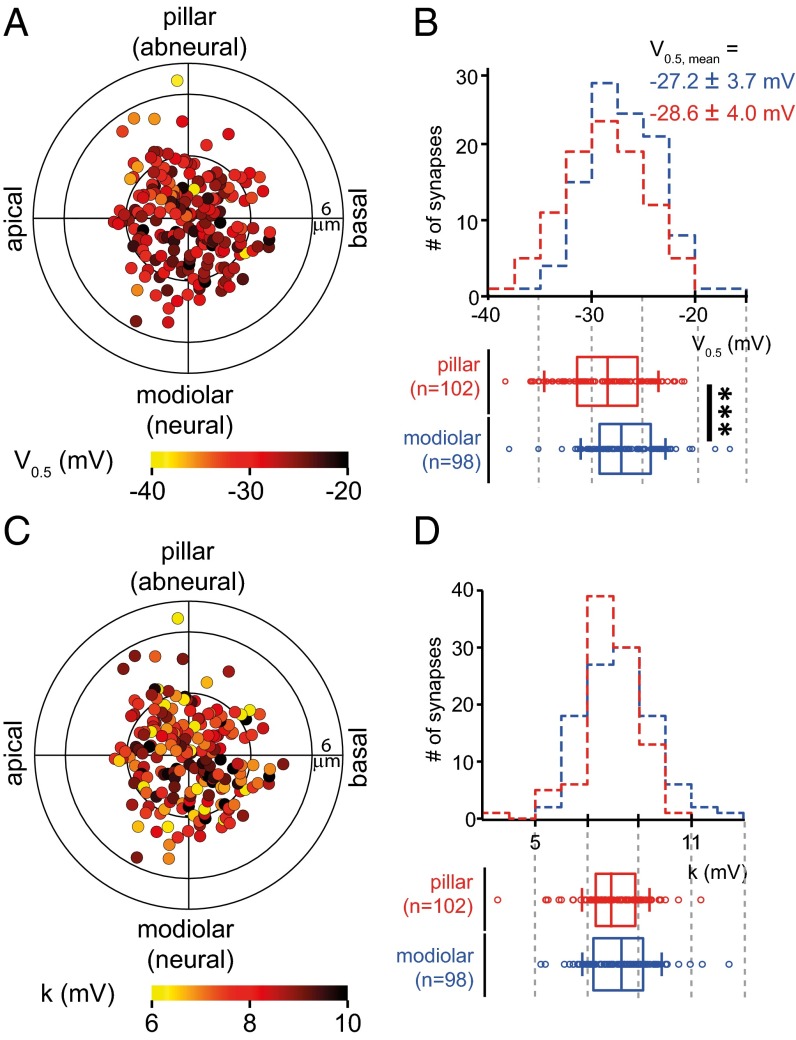
Fig. 4.
Spatial gradients of voltage-dependent activation of AZ Ca2+ influx. (A and C) Polar charts display V0.5 (A) and k (C) of 210 AZs of 25 IHCs as a function of AZs location within IHCs (as in Fig. 2A). (B and D) (Upper) Histograms of V0.5 (B) or k (D) of AZs on the modiolar side (blue) and pillar side (red). (Lower) The box plots of V0.5 or k for pillar and modiolar AZs. V0.5 was more hyperpolarized for pillar AZs than for modiolar AZs (P < 0.001, Wilcoxon rank sum test). Modiolar and pillar AZs did not show statistically significant differences in k.

