Fig. 5.
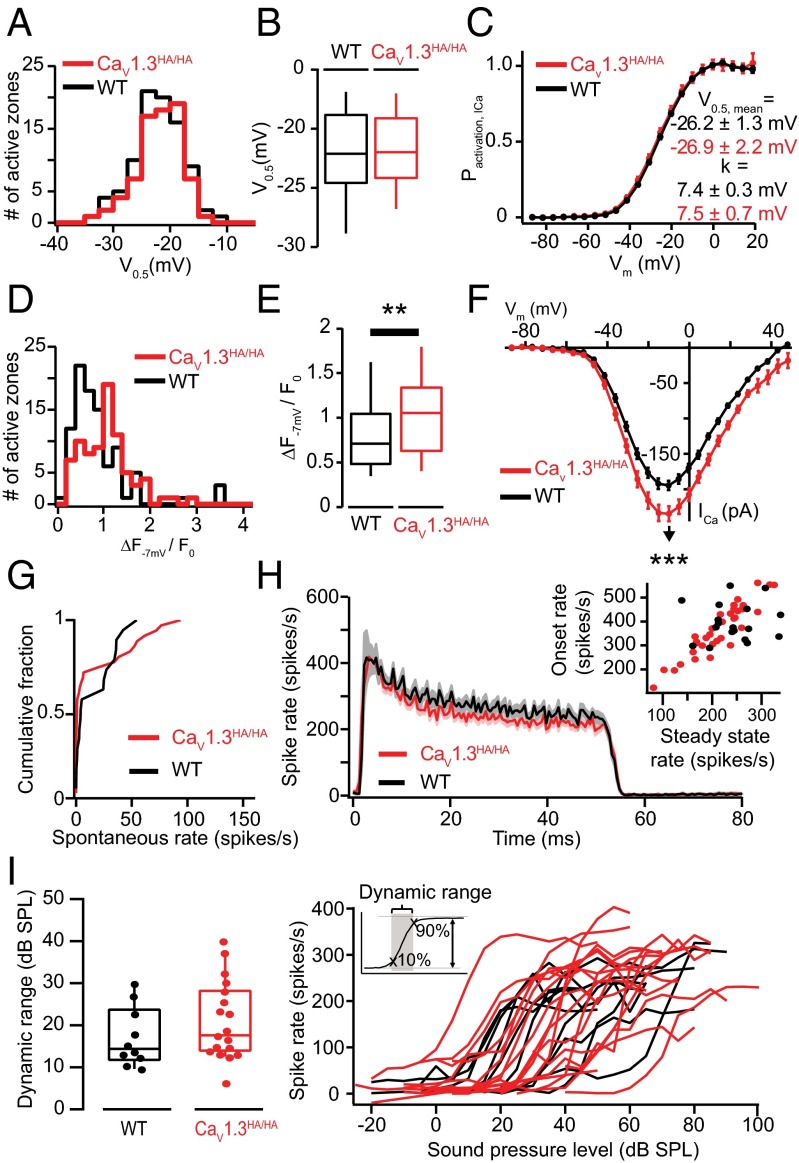
Disrupting the C-terminal regulatory domain of CaV1.3 does enhance maximal synaptic Ca2+ influx but does not alter V0.5 heterogeneity and sound encoding. (A) Distributions of V0.5 of the AZ Ca2+ influx in Cav1.3HA/HA (red, 76 AZs of 10 IHCs) and WT (black, 89 AZs of 10 IHCs) mice. Experiments were performed as in Fig. 3. (B) Box-whisker charts of V0.5 of the AZ Ca2+ influx: nonsignificant differences for Cav1.3HA/HA. (C) Comparable fractional activation of Ca2+ current as a function of voltage for IHCs of both genotypes. Neither V0.5 nor k has significant differences observed between the two different mouse strains. Experiments and analysis were conducted as described in SI Methods. (D) Distributions of maximal AZ Ca2+ influx in Cav1.3HA/HA (red, 79 AZs of 10 IHCs) and control (black, 94 AZs of 10 IHCs) mice. Experiments were performed as in Fig. 1B. (E) Box-whisker charts of maximal AZ Ca2+ influx in Cav1.3HA/HA IHCs, which was significantly stronger than that of WT IHCs (P < 0.01, Wilcoxon rank sum test). (F) Current–voltage relationship of the whole-cell Ca2+ current of IHC in WT (black) or Cav1.3HA/HA (red). The Cav1.3HA/HA IHC has larger maximal Ca2+ current than the WT cells (P < 0.001, ICa,−7 mV,WT = −194.6 ± 6.6 pA, ICa,−7 mV,HA = −234.6 ± 10.6 pA). The errors in this panel are SEM. (G) Histogram showing the spontaneous rate distribution of CaV1.3HA/HA and WT SGNs. (H) Average poststimulus time histogram of SGN responses to 50-ms suprathreshold tone bursts at the characteristic frequency. Both the onset (average firing rate in a 1-ms window after median first spike latency) and steady-state rate (average firing rate over the last 5-ms window of 50-ms tone bursts) did not differ significantly between CaV1.3HA/HA and WT SGNs. (I) Rate-level functions (Right) and dynamic range (Left) for CaV1.3HA/HA and WT SGNs. Dynamic range is defined as the range of sound pressure levels in which the rate-level function showed a rate increase between 10% and 90% of the difference between spontaneous and maximum rate. No statistically significant difference between the dynamic ranges was observed between CaV1.3HA/HA and WT SGNs (19 for CaV1.3HA/HA vs. 10 for WT SGNs, not significant by Wilcoxon rank sum test).

