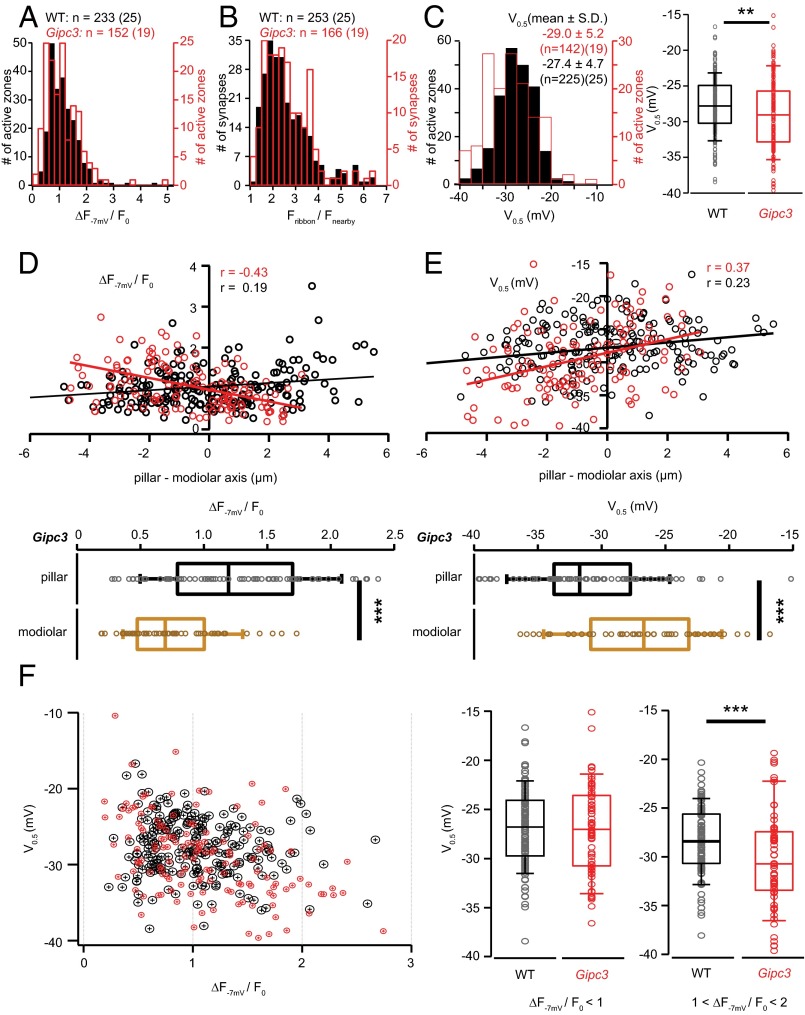
Fig. 7.
Disruption of Gipc3 in mice shifts the activation of Ca2+ influx to more hyperpolarized potentials and reverses the modiolar–pillar gradient of maximal Ca2+ influx. (A) Distribution of maximal AZ Ca2+ influx in IHCs of Gipc3 mutant (red trace, n = 152, 19 cells) and WT mice (blue trace, 225 AZs of 25 cells). The experimental protocol is the same as Fig. 1B. (B) Distribution of the AZ TAMRA-peptide fluorescence in Gipc3 mutant IHCs (red trace, 166 AZs, 19 IHCs) and WT IHCs (blue trace, 253 AZs of 25 IHCs). (C, Left) Distribution of V0.5 of the voltage-dependent activation of AZ Ca2+ influx in Gipc3 mutant IHCs (red trace, 142 AZs of 19 IHCs) and WT IHCs (blue trace, n = 225, 25 cells). The experimental protocol is the same as Fig. 3A. (C, Right) Box plot of V0.5 of voltage-dependent activation of AZ Ca2+ influx in Gipc3 mutant IHCs: V0.5 was significantly more hyperpolarized in Gipc3 mutant IHCs (P < 0.01, Wilcoxon rank sum test). (D, Upper) Opposing gradients of maximal AZ Ca2+ influx in Gipc3 (red circle, 128 AZs of 19 IHCs) and WT (blue circle, 226 AZs of 25 IHCs) along the modiolar–pillar axis. Solid lines are their fitting lines, r indicates their correlation coefficients. (D, Lower) The box plots summarize the distributions of maximal Ca2+ influx of pillar and modiolar AZs for Gipc3 mutant IHCs. The maximal AZ Ca2+ influx of pillar AZs was significantly stronger than that of pillar AZs (P < 0.001, Wilcoxon rank sum test). (E) (Upper) Spatial distribution of the V0.5 in Gipc3 mutant IHCs (red circle, 119 AZs of 19 IHCs) and WT IHCs (blue, 194 AZs, 21 IHCs) along the modiolar–pillar axis. Solid lines are line fits to the data. (E, Lower) Box plots summarize the V0.5 distributions of pillar and modiolar AZs in Gipc3 mutant IHCs. The V0.5 of pillar AZs was significantly more hyperpolarized than that of modiolar AZs (P < 0.001, Wilcoxon rank sum test). (F, Left) The relationship of maximal AZ Ca2+ influx and V0.5 (red: Gipc3, blue: WT). (F, Right) Box-whisker charts summarize the distributions of V0.5 in subgroups of their ΔF−7 mV/F0: smaller than 1 (Left) and between 1 and 2 (Right). V0.5 of AZs from Gipc3 mutant IHCs were more hyperpolarized (−30.2 ± 4.9 mV) than those of WT IHCs (−28.4 ± 3.5 mV, P < 0.001, Wilcoxon rank sum test) for the subgroup of AZs with ΔF−7 mV/F0 is between 1 and 2, whereas it was statistically indistinguishable for the AZ subgroup with smaller maximal Ca2+ influx.

