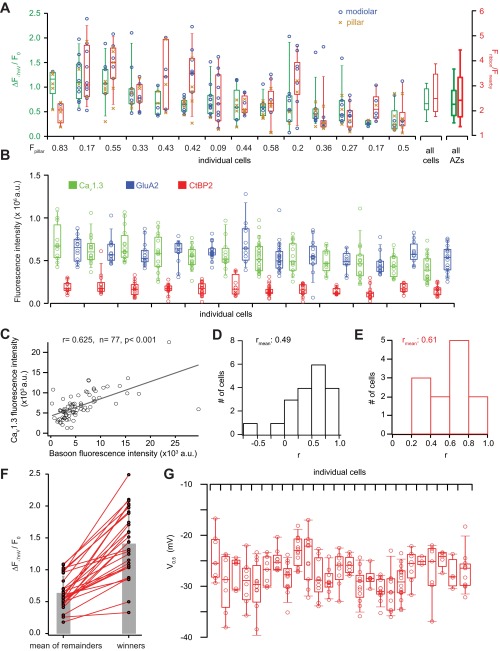
Fig. S1.
Quantification of functional and molecular markers of the strength of IHC synapses. (A) Box plots (10, 25, 50, 75, and 90% values) show the statistics of maximal AZ Ca2+ influx (ΔF−7mV/F0, green) intensity and of RIBEYE-peptide fluorescence (red) of AZs in individual cells (left), of mean ΔF−7mV/F0 and mean RIBEYE-peptide fluorescence of all cells (right), and of ΔF−7mV/F0 and of RIBEYE-peptide fluorescence all AZs (rightmost) as recorded in the live-imaging experiments. Individual data points are superimposed on the box plots of the individual IHCs, with color coding for modiolar (blue) or pillar (amber) position of the AZ. The number underneath each IHC represents the fraction of pillar AZs. (B) Statistics of the immunofluorescence for all labeled synapses of individual IHCs in the organ of Corti. Box plots display the distributions of the immunofluorescence intensity of presynaptic Cav1.3 clusters (green) and RIBEYE/CtBP2-labeled ribbons (red) as well as GluA2-labeled glutamate receptor clusters (blue). Individual data points are superimposed on the box plots of the individual IHCs. (C) Scatter plot of the immunofluorescence intensity of presynaptic Cav1.3 clusters and corresponding bassoon immunofluorescence. (D) Correlation of maximal AZ Ca2+ influx and RIBEYE-peptide fluorescence within individual IHCs. Histogram displays the distribution of the correlation coefficients of individual IHCs in the live-imaging experiment: The average correlation coefficient among cells in the live-imaging experiment was 0.49. (E) Correlation of CaV1.3 and RIBEYE/CtBP2 immunofluorescence within individual IHCs. Histogram displays the distribution of the correlation coefficients of individual IHCs in the immunolabeled organ of Corti. The averaged correlation coefficient among cells was 0.61 in immunohistochemistry. (F) AZ Ca2+ influx between the strongest AZ (winners) and the mean of the remaining AZs in individual IHCs. Gray: mean ± SEM. (G) Box plots and individual values of V0.5 of the AZs within individual IHCs.

