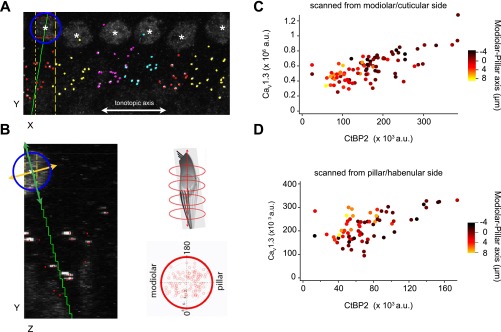
Fig. S3.
Analysis of AZ properties by synaptic position on the IHC. (A and B) Multicellular alignment via 3D transformation from Cartesian coordinates of the confocal stack to a cell-centric cylindrical coordinate system, using custom MATLAB routines. For each cell, the nuclear center (white asterisks) was registered in three dimensions using the nuclear immunoreactivity of the CtBP2 antibody. The tonotopic dimension for each image was approximated as the confocal microscope’s X dimension (white line in A) by adjusting the rotation of the region of interest. Synapses were sorted by cell, based on proximity to nuclei and orientation of each juxtaposed pre- and postsynaptic pair of CtBP2- and GluA2-labeled puncta. A and B show the CtBP2 channel only. Presynaptic ribbons are marked with dots colored by cell. The center of the nucleus defined one point on a line chosen as the cell’s central longitudinal axis. The cell on the left of A (XY plane) has a blue circle around the nucleus. IHCs were visualized individually in the ZY plane by projecting a volume limited along the X axis, within the width of the cell nucleus (yellow vertical lines in A). Synapses belonging to this cell, but positioned outside of the subvolume displayed in the ZY plane, were included as colored markers (red dots without accompanying fluorescence in B). The center of each nucleus was defined as zero on the central longitudinal axis, which extended positively toward the basal pole of the IHC from the direction of the cuticular plate toward the habenula perforata. The second point defining this axis was set by adjusting the axis line in the XY plane (green line in A) and in the ZY plane (green line in B). In the YZ plane, visualizing only the synapses belonging to the cell being analyzed, the axis was chosen based on a user-defined balance of synapses on either side of a line through the nuclear center and through the cluster of synapses at the basal pole. The IHC central longitudinal axis (green) is perpendicular to the defined modiolar–pillar axis in the ZY plane (orange line in B). Using the cell-centric cylindrical coordinates, data from all six cells in the image were overlaid on a projection along the longitudinal axis (polar plot, B, lower right). The longitudinal axis is orthogonal to the plane defined by the perpendicular tonotopic axis (0–180°) and modiolar–pillar axis. (C and D) Synapses with greater CaV1.3 and CtBP2 fluorescence tended to be positioned toward the modiolar side of the modiolar–pillar axis. In C, the scatter plot is for the six cells shown in A, imaged with the modiolar side toward the objective in a top-down sequence, imaging the modiolar-side synapses first. In D, the scatter plot is for the same six cells imaged with opposite orientation of the specimen, to control for potential artifacts due to optical attenuation and bleaching. The modiolar-side synapses closer to the coverslip and imaged first in C were further from the coverslip and imaged last in D. A similar relationship was observed in each case, showing that modiolar synapses tended to have more immunofluorescence for CaV1.3 and CtBP2.

