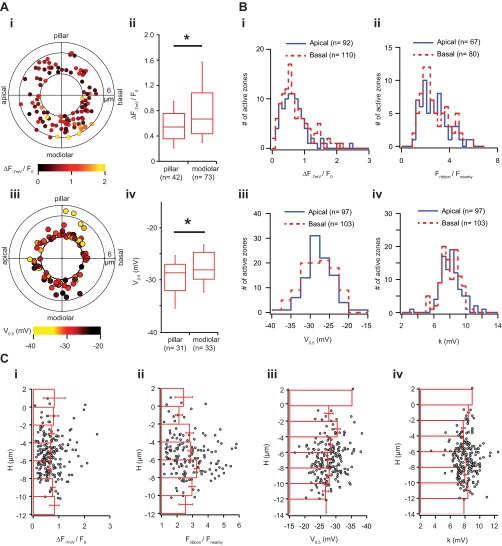
Fig. S4.
AZ properties as a function of position within the IHC. (A) Spatial distribution of maximal AZ Ca2+ influx (ΔF−7mV/F0) without the basal cap. (i) Polar chart displays ΔF−7mV/F0 as a function in position, when AZ were projected along the central axis. In contrast to Fig. 2A, we removed AZs with a radius smaller than 3 µm, which are mostly located on the basal end of IHC (n = 115) and pose a challenge to assign to one of the sectors. (ii) Box plots describe the distribution of ΔF−7mV/F0 of modiolar and pillar halves. The AZs on the modiolar half had significantly stronger ΔF−7mV/F0 than those on the pillar half. (iii) Polar chart displays V0.5 as a function in position, when AZ were projected along the central axis. In contrast to Fig. 4A, we removed AZs with a radius smaller than 3 µm, which are mostly located on the basal end of IHC and pose a challenge to assign to one of the sectors. (iv) Box plots describe the distribution of V0.5 on modiolar and pillar halves. The AZs of the pillar half had significantly more hyperpolarized V0.5 than those of the modiolar side. (B) No obvious gradients of synaptic properties along the tonotopic axis. (i) The distributions of maximal AZ Ca2+ influx (ΔF−7mV/F0), (ii) intensity of RIBEYE-peptide fluorescence, (iii) V0.5, and (iv) k in both tonotopical apical (low-frequency) and basal (higher-frequency) sides of IHCs. There are no significant statistical differences observed between these two sides in all four measured parameters (Wilcoxon rank sum test). (C) No obvious gradients of synaptic properties along the longitudinal axis. This figure shows the spatial arrangements of (i) maximal AZ Ca2+ influx (ΔF−7mV/F0), (ii) the intensity of RIBEYE-peptide fluorescence, (iii) V0.5, and (iv) k along the longitudinal axis of the IHC. The 0 layer of the H position corresponds to the plane with the largest IHC cross-section on the axis Vz (Fig. S2). Positive H values indicate an AZ position closer to cuticular plate, and negative closer to the basal pole. Red bars in this figure represent the mean and SD of the corresponding quantity in their specified longitudinal positions.

