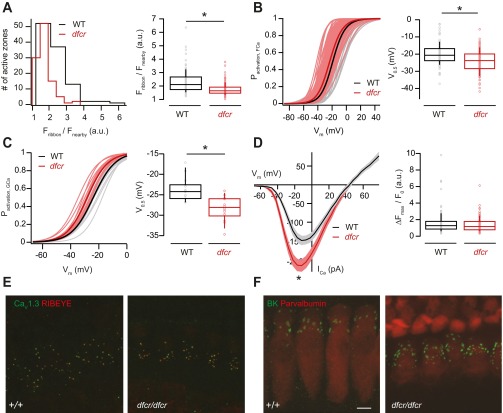
Fig. S5.
Genetic disruption of harmonin function leads to decreased ribbon size and hyperpolarizing shift of the activation of Ca2+ influx but leaves developmental confinement of Ca2+ and expression of large-conductance Ca2+-activated K+ channels unaltered. (A) Distribution of the intensities of AZ TAMRA-peptide fluorescence in dfcr (red, 105 AZs of 15 IHCs, c.v. = 0.26) and in WT (BALB/c, black, 107 AZs of 14 IHCs, c.v. = 0.35) IHCs (Left) and box plot (Right) depicting a significant decrease in the fluorescence intensity of labeled ribbons in dfcr IHCs (Left, P < 0.05, Wilcoxon rank sum test). (B) Fractional activation of AZ Ca2+ influx shows comparable heterogeneity of dfcr (red) and WT (black) IHCs, but a more hyperpolarized mean V0.5 in dfcr IHCs (Right, P < 0.05, t test). Experiments were performed as in Fig. 3. Thin lines present the fractional activation of individual AZs of dfcr (light red, 105 synapses) and WT (gray, 107 synapses) and thick red and black lines the mean fractional activation, respectively. (C) Fractional activation of the whole-cell Ca2+ conductance (GCa). (Left) The activation of single IHCs (thinner and lighter traces) from dfcr (red and light red, 14 IHCs) and WT (black and gray, 15 IHCs) and mean fractional activation of all IHCs (thick and dark traces), respectively. In agreement with the single AZ data (B), the mean V0.5 of the whole-cell Ca2+ conductance was also shifted toward more hyperpolarized potentials in the dfcr cells (Right, P < 0.05, Wilcoxon rank sum test). (D) Current–voltage relationship for ICa evoked by 20-ms voltage steps in whole-cell patch-clamp recordings from dfcr (red, 14 IHCs) and WT (black, 15 IHCs) cells showing an increased Ca2+ current peak in the dfcr mice (Left, mean ± SEM, P < 0.05, Wilcoxon rank sum test). However, the maximal AZ Ca2+ influx dfcr (red, 105 AZs, c.v. = 0.61) was not significantly different from that of WT (black, 107 AZs, c.v. = 0.83), suggesting an increased extrasynaptic Ca2+ influx (Right). (E) Maximum projection of confocal sections of organs of Corti immunolabeled for CaV1.3 (green) and RIBEYE/CtBP2 (red). Most CaV1.3 immunofluorescence was confined to presynaptic AZs (labeled by the RIBEYE immunofluorescence) in both dfcr (Right) and WT (Left) IHCs. Immaturity would have expected to show more ribbons and many more CaV1.3 immunofluorescence spots (29). (F) Maximum projection of confocal sections of organs of Corti immunolabeled for large-conductance Ca2+-activated K+ channels (BK, green) and the EF-hand Ca2+ binding protein parvalbumin (red). Spot-like BK immunofluorescence, most likely reflecting BK channel clusters was found at the ‟neck” of the IHC in both dfcr (Right) and WT (Left) IHCs. Immaturity would have expected to cause a lack of BK immunofluorescence. (Scale bar: 10 µm.)

