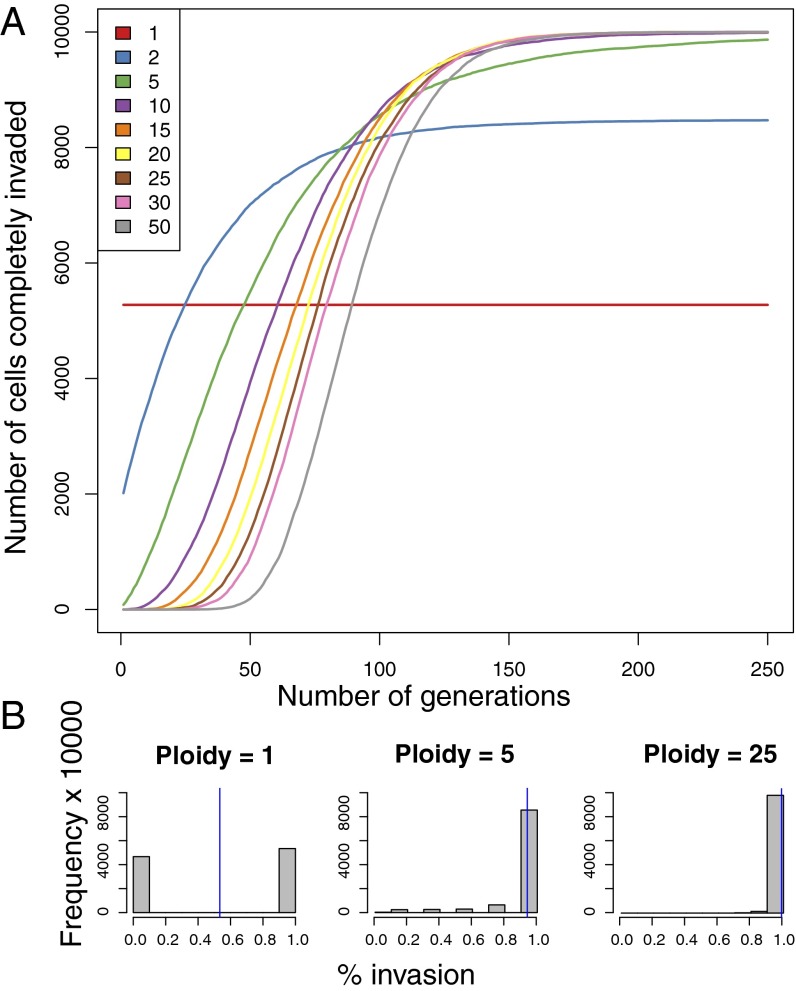
Fig. 3.
Simulations to assess the effect of ploidy on intein invasion dynamics after fusion. Two cells, one completely invaded and one uninvaded, fuse, and chromosomes are assumed to assort randomly onto the daughter cells. Ten thousand cells are followed for 250 generations. (A) The number of cells completely invaded after each generation is recorded with the ploidy number as parameter, which is indicated by the colors in the legend. (B) Ten thousand cells are followed over 100 generations, and the percent of intein invasion in each cell is recorded. The blue line indicates the mean percent invasion for each ploidy number simulated.

