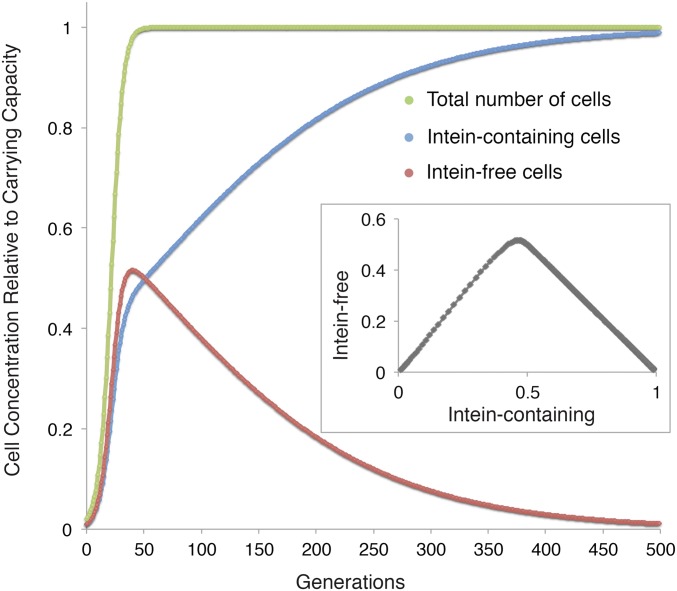
Fig. 4.
Simulation of intein invasion dynamics in a population with carrying capacity. Cell number is plotted relative to the carrying capacity over 500 generations. The inset gives concentration of intein-free alleles plotted against the concentration of intein-containing alleles. Note that initially, due to the fitness cost of the intein, the intein-free cells outgrow the intein-containing ones; however, even with the low homing efficiency of 0.01 assumed in this simulation, the intein spreads throughout the population as the growth rate declines closer to carrying capacity. The results remain qualitatively the same even when the carrying capacity is assumed to be equally affected by the fitness cost (Fig. S2). Parameters are as follows: homing efficiency = 0.01, fitness cost of the intein = 0.075, carrying capacity = 1, growth rate = 0.2 per generation, and starting concentration = 0.01 each for the intein-containing and intein-free cells.

