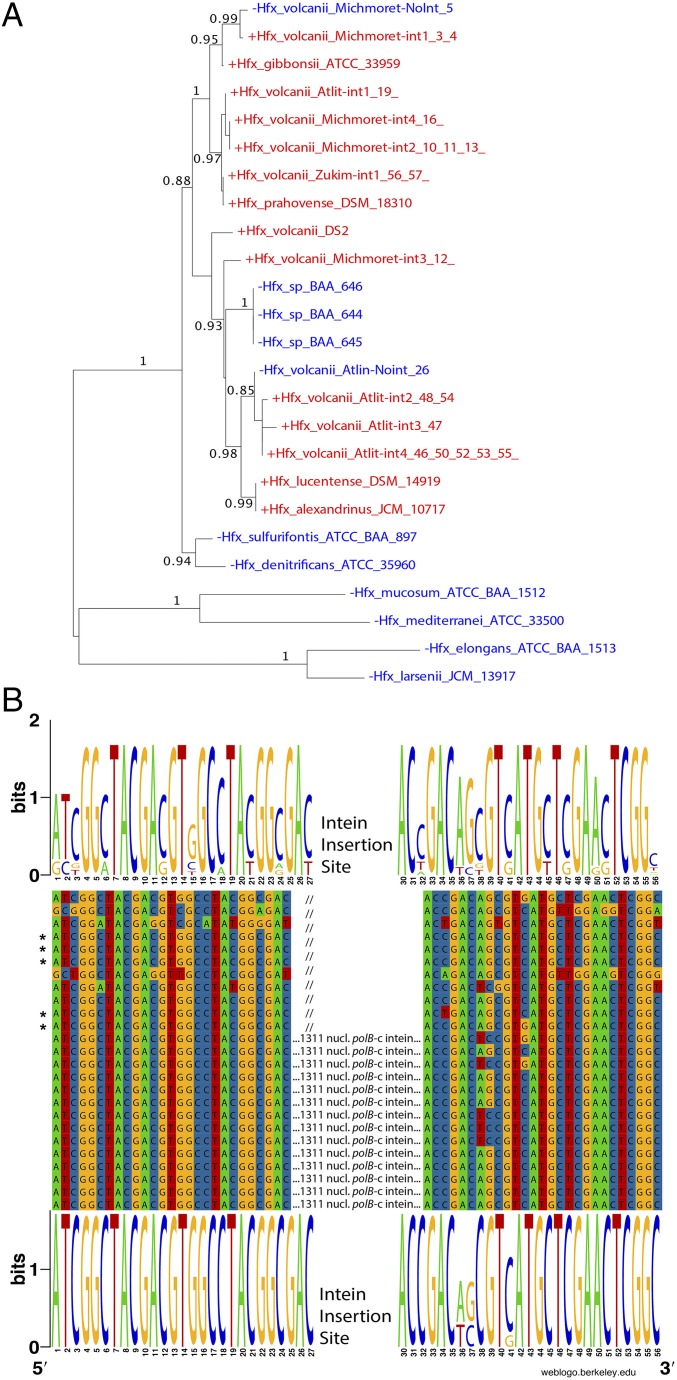
Fig. 6.
Maximum likelihood phylogeny for polB extein sequences (A) and conservation of polB-c intein insertion sites (B). Numbers give support values calculated using the approximate likelihood ratio test as implemented in phyml 3.0 (51). Although drawn as rooted, the tree should be considered unrooted. The finding that sequences without (blue) and with (red) intein do not always form distinct clans (53) reveals that invasion of the Haloferax genus with the polB-c intein is an ongoing process. B shows a polB nucleotide sequence alignment around the intein insertion site c. Web logos (52) give the site conservation for intein minus (Top) and intein plus (Bottom) sequences. The five intein minus sequences that group within the cluster of intein plus sequences are marked with asterisks. The intein minus sequences show greater nucleotide diversity surrounding the intein insertion site, mainly in synonymous positions—only two positions at the 5′ and close to the 3′ end of the alignment represent nonsynonymous changes. Homing endonuclease site specificity was shown to tolerate substitutions that result in nonsynonymous changes (54), suggesting that none of the depicted Haloferax sequences may be immune to intein invasion.

