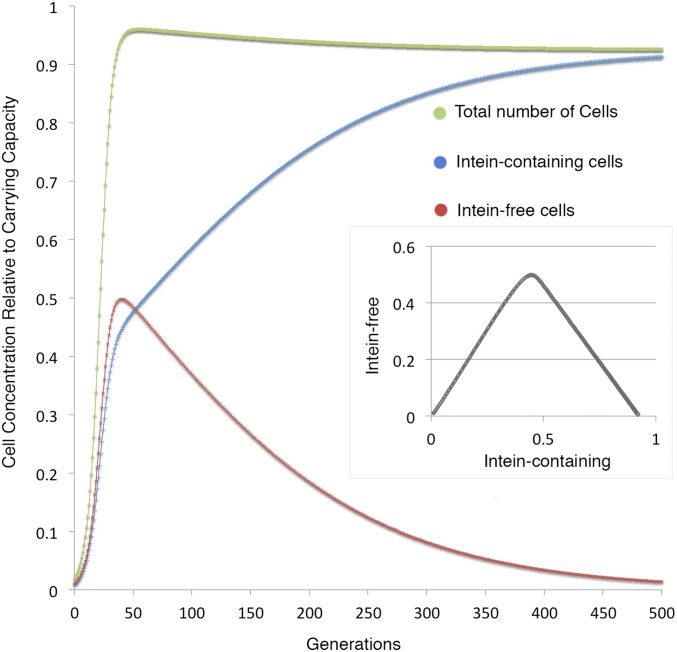
Fig. S2.
Intein invasion dynamics in a population with carrying capacity. Number of cells relative to the carrying capacity is plotted for the total number of cells (green line), the intein-containing cells (blue line), and the intein-free cells (red line) over 500 generations. Inset shows the concentration of intein-free alleles plotted against the concentration of intein-containing alleles. The simulation assumes that the fitness cost lowers the growth rate as well as the carrying capacity of the intein-containing cells. Parameters are as follows: homing efficiency = 0.01, fitness cost = 0.075, carrying capacity = 1, growth rate = 0.2 per generation, and starting concentration = 0.01 each for the intein-containing and intein-free cells.

