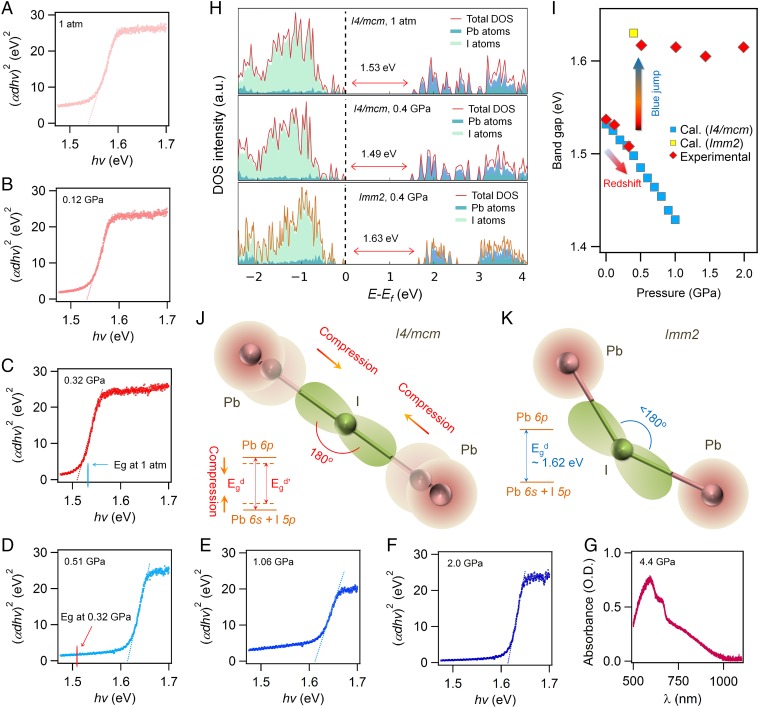
Fig. 2.
Realization of band edges approaching in MAPbI3 single crystal upon compression. (A–F) Direct band-gap Tauc plots for MAPbI3 single crystals at 1 atm, 0.12 GPa, 0.32 GPa, 0.51 GPa, 1.06 GPa, and 2.0 GPa, respectively. The magnitude of band gap can be determined by extrapolating the linear portion of the Tauc plot to the baseline. Pressure-driven red-shift of the band gap gradually occurs between 1 atm and 0.3 GPa, followed by a blue jump at 0.51 GPa, corresponding to the low-pressure and high-pressure phase ranges, respectively. (G) Absorption spectroscopy measured at 4.4 GPa, in which no clear onset of absorption was observed corresponding to the amorphous nature. (H) Density of states (DOS) of MAPbI3 with a structure of I4/mcm at 1 atm (Top), I4/mcm at 0.4 GPa (Middle), and Imm2 at 0.4 GPa (Bottom). Clearly, our calculations reproduced the red-shift and blue jump, as evidenced by the band-gap values of 1.53, 1.49, and 1.63 eV, respectively. (I) Pressure-driven band-gap evolution of MAPbI3. Band edges approaching was realized in a low-pressure phase range. (J and K) Schematic models of the red-shift and blue jump, respectively. For the I4/mcm phase, as pressure increased, the dominated Pb–I–Pb bond angle kept 180° and the electron wave function overlapped more; thus, the bandwidth of both the valance band and the conduction band expanded. For the Imm2 phase, the Pb–I–Pb bond angle became much smaller than 180° and the electron wave function overlapped much less than that in the I4/mcm phase.

