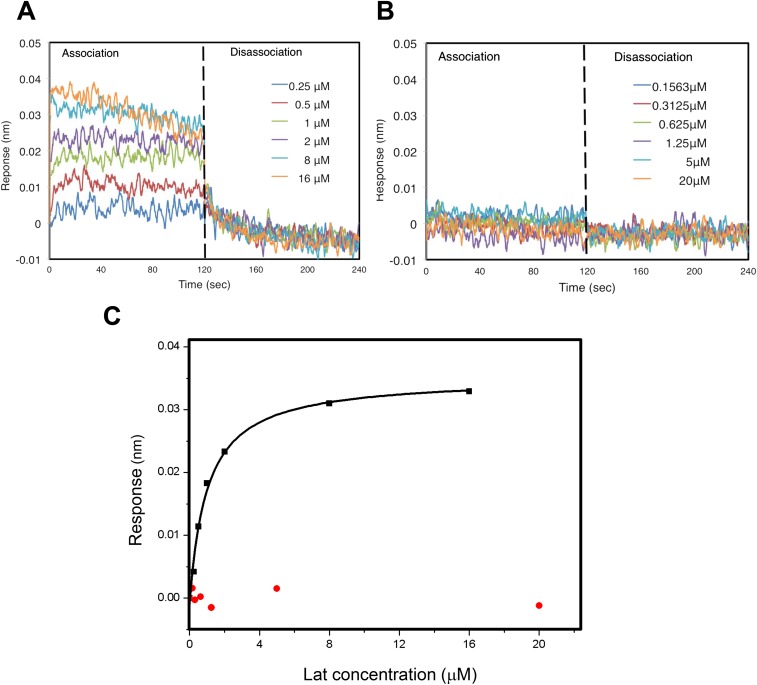
Fig. S6.
Binding of latrunculin to G-actin and the N-actin complex analyzed by BLI. (A) Binding of latrunculin to G-actin monitored by the super streptavidin biosensor using BLI. G-actin at a ∼2 μM concentration was labeled with biotin and bound to streptavidin-coated sensors. After washing away loosely bound materials, association was initiated by dipping the G-actin conjugated sensors in the buffer containing latrunculin at different concentrations and was monitored at real time for 120 s. Dissociation was initiated by dipping the same sensors into buffers without latrunculin and was monitored similarly. Individual graphs with indicated concentration of latrunculin were grouped together and showed. (B) Interaction of latrunculin with the N-actin complex monitored as in A. No association or dissociation of latrunculin was detected in the presence of the N-actin complex. (C) BLI analysis of the binding of latrunculin to G-actin (black) or the N-actin complex (red). Fitting the binding curve of latrunculin to G-actin yielded the Kd ∼ 1 μM, whereas no binding to the N-actin complex was observed.

