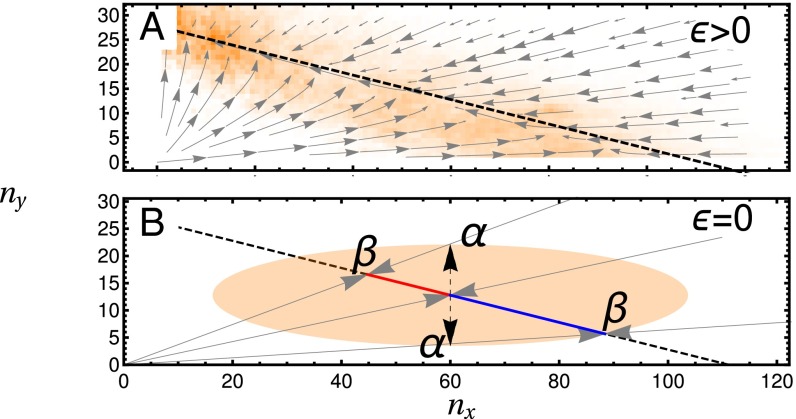
Fig. 1.
System dynamics in the phenotype plane. Deterministic trajectories are shown as gray arrows. (A) Trajectories rapidly collapse to a SM (black dashed line), before slowly moving to the nonproducing Y fixed point. Stochastic trajectories (histogram overlaid in orange) remain in the region of the SM but may fluctuate away from it. (B) Illustration of the origin of noise-induced selection. The orange ellipse depicts the SD of Gaussian fluctuations originating at its center. Fluctuations (black dashed arrows) to points α are equally likely; however, when projected back to the CM (black dashed line) to points β, a bias for producing the X phenotype is observed. Parameters used are in A, in B, and the remaining parameters are given in Table S2.

