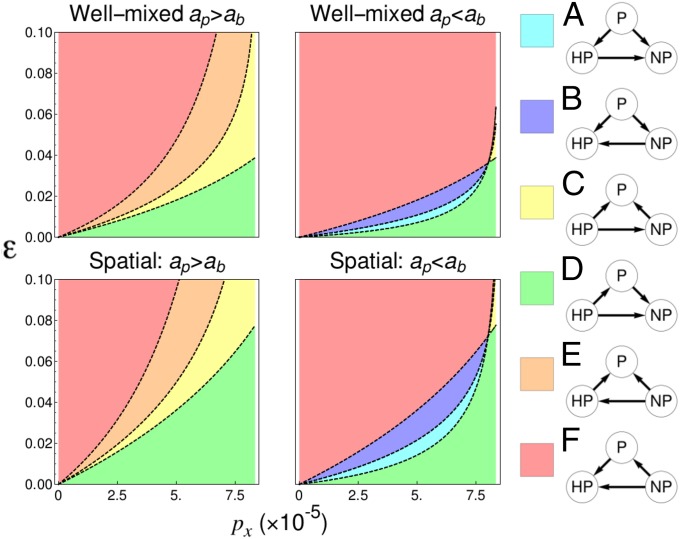
Fig. 5.
Plots of the pairwise invasibility scenarios possible for nonproducing (NP), producing (P), and hyperproducing (HP) phenotypes. Arrows point away from the dominant phenotype in a pair, which is defined as that with a larger invasion probability (Fig. S3). Nontransitive dynamics are not possible. It is possible, however, for an optimal intermediate good production rate to emerge (cyan and purple regions), if In this scenario the hyperproducer receives diminishing good production as a function of cost to birth rate compared with the producer. (Left) and (Right) and Remaining parameters given in Table S2.

