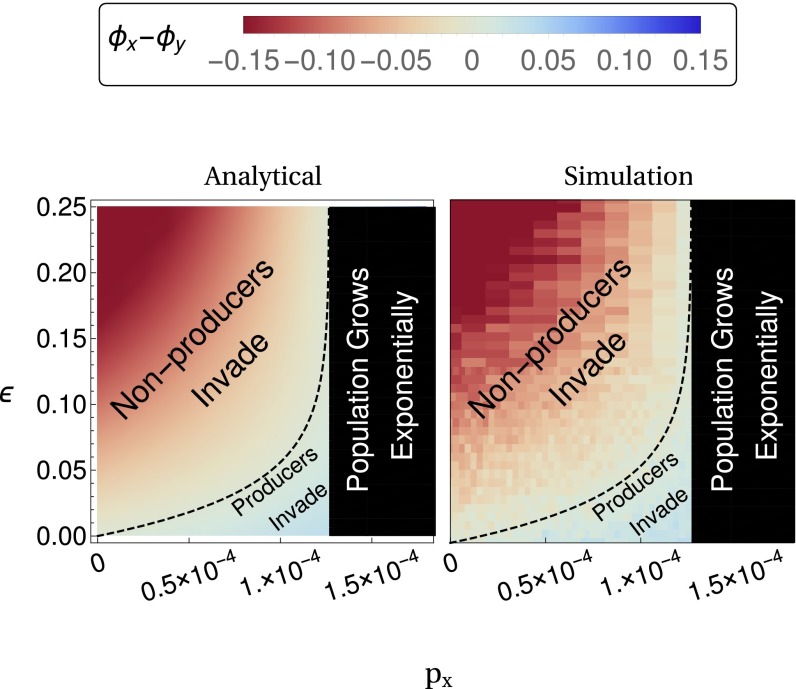
Fig. S2.
Illustration of the larger range of values for the parameter ε over which the approximation Eq. S28 is accurate. Parameters are given in Table S2, with the exception of and ε, which are varied. Note that this figure is similar to Fig. 2, in the main text, but plotted over a greater range of ε and The parameter region plotted in black is that for which

