Fig. 3.
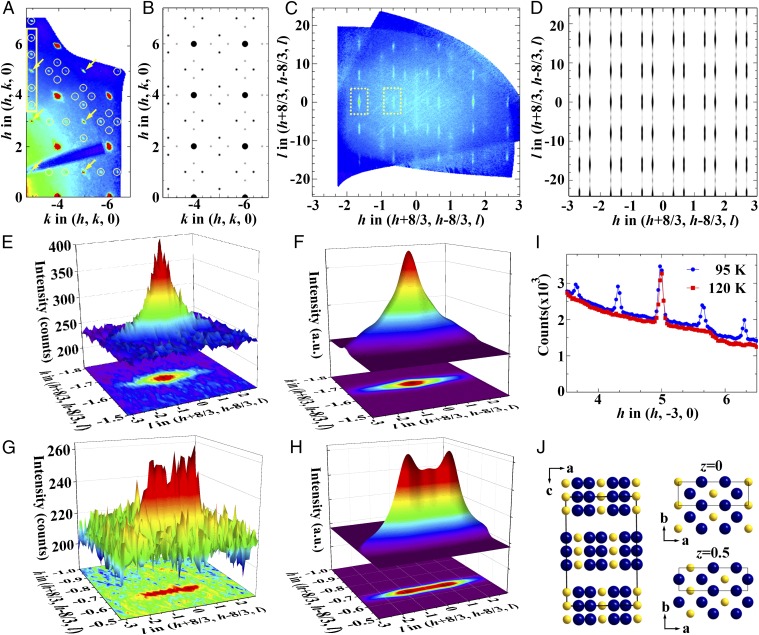
Charge stripe ordering in La-438. (A and C) Reconstructed (hk0) and (h + 8/3, h − 8/3, l) planes (F4/mmm notation) measured below 105 K at 15-ID-B. Note that intensity at the forbidden peaks [e.g., (1, −5, 0), (3, −5, 0), (5, −3, 0), …], as indicated by yellow arrows in A, results from leakage of intensity from allowed Bragg reflections at positions (h, k, ±1) (SI Text, Diffuse Scattering Along c* and Fig. S5). (E and G) Measured SL peaks at (1, −4.333, 0) and (2, −3.333, 0) as indicated by dashed yellow rectangles in C. (B, D, F, and H) Simulated diffraction patterns based on the charge stripe model shown in J. The size of the spots in B indicates the intensity. (I) Intensity along the line (h, −3, 0) at 95 K (blue circles) and 120 K (red squares). (J) Charge stripe model in real space. Yellow spheres represent areas of higher valence than the average 1.33+, and blue spheres represent areas of lower valence than the average 1.33+. Solid rectangles denote the charge stripe supercell.

