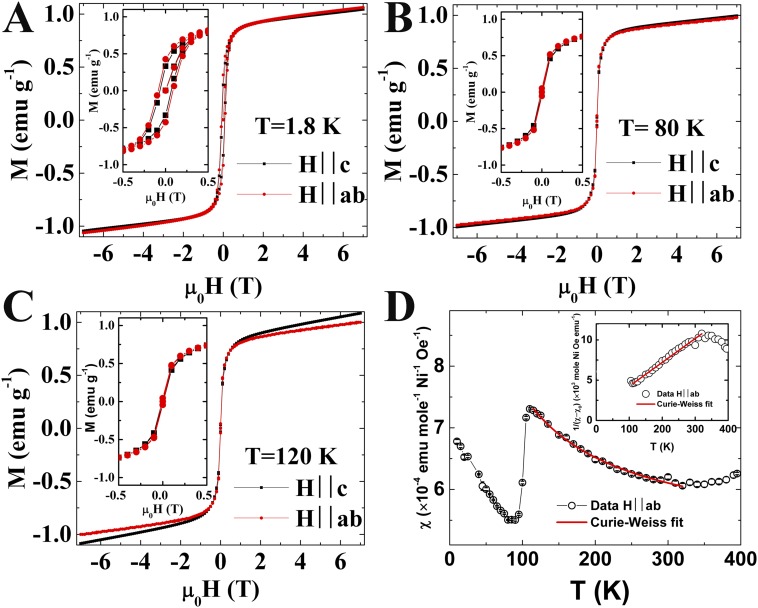
Fig. S2.
Magnetization and extracted magnetic susceptibility. (A–C) Magnetization vs. magnetic field at various temperatures. (D) Extracted magnetic susceptibility from M(H) curves (SI Text). D, Inset shows inverse magnetic susceptibility, 1/(χ − χ0), as a function of temperature. Error bars in D represent the estimated SD for the linear fit of M(H) curves, and they are smaller than symbols for χ.

