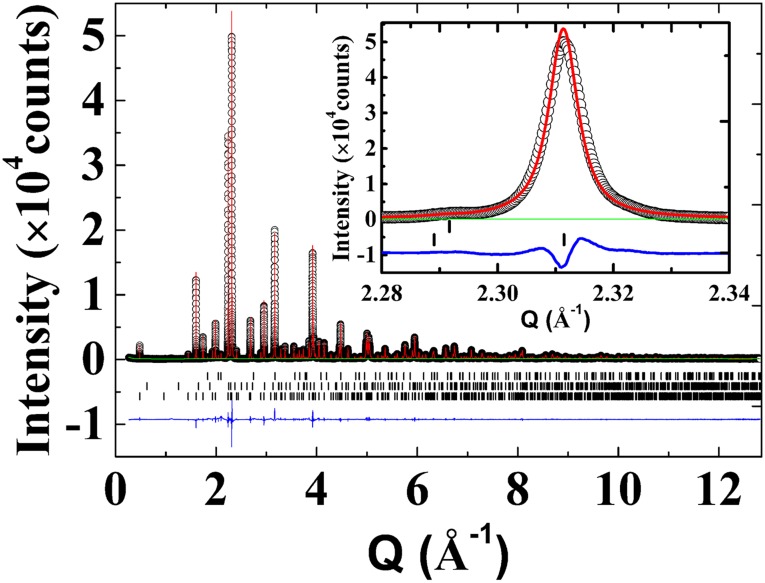
Fig. S4.
High-resolution synchrotron X-ray diffraction pattern of La-438 at room temperature. Black circles, red curve, green curve, black bars, and blue curve correspond to the observed data, calculated intensity, background, Bragg peaks, and difference curve, respectively. The black bars show (Bottom) La-438, (Middle) La3Ni2O6.35, and (Top) La2O3. Inset shows the quality of fit in Q range of 2.28–2.34 Å−1.

