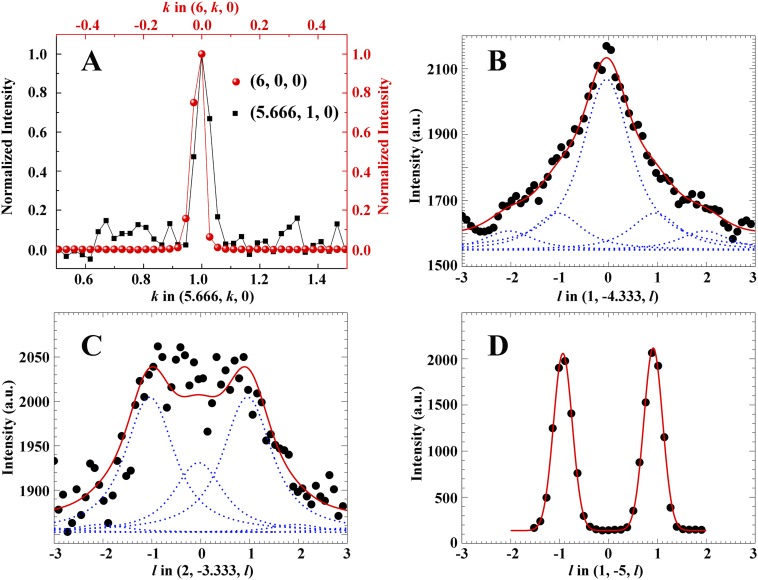
Fig. S6.
Peak shapes and correlation length. (A) Peak shapes of the SL peak (5.666, 1, 0) and the main Bragg peak (6, 0, 0) along the k direction. Because of the huge intensity ratio of the main Bragg and SL peaks, here, the main Bragg peak (6, 0, 0) is taken from a short time exposure, whereas the SL peak (5.666, 1, 0) is taken from a longer time exposure experiment with the other parameters the same. (B and C) Cuts through sets of SL reflections (1, −4.333, l) and (2, −3.333, l) and corresponding fit convolved with effective resolution function. All SL peak amplitudes in B and C were constrained in accordance with the structure factor calculations and also, constrained to have the same finite correlation length. Blue dots, decomposed peaks; red, overall fit. (D) A typical cut along l through main Bragg peaks.

