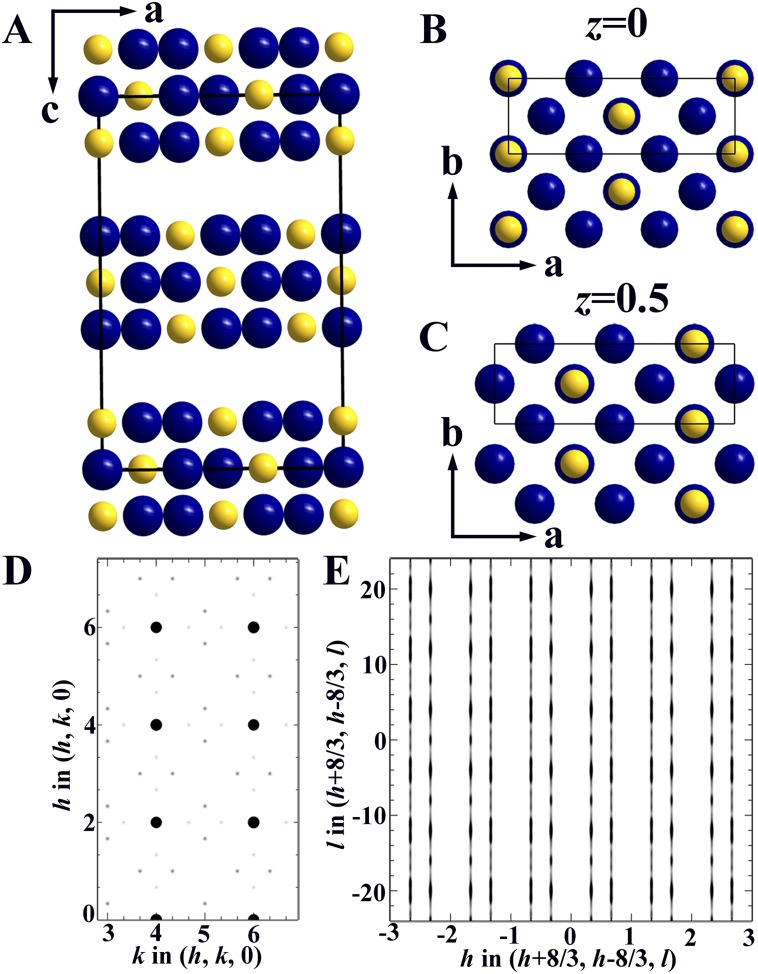
Fig. S7.
Charge stripe model 2 and simulated diffraction patterns. (A) Charge stripe model in the ac plane. Yellow spheres represent areas of higher valence than the average 1.33+. Blue spheres represent areas of lower valence than the average 1.33+. Solid rectangle denotes the charge stripe supercell. (B) Charge distribution in the ab plane at z = 0. (C) Charge distribution in the ab plane at z = 0.5. (D) Calculated diffraction pattern in the (h, k, 0) plane. (E) Calculated diffraction pattern in the (h + 8/3, h − 8/3, l) plane.

