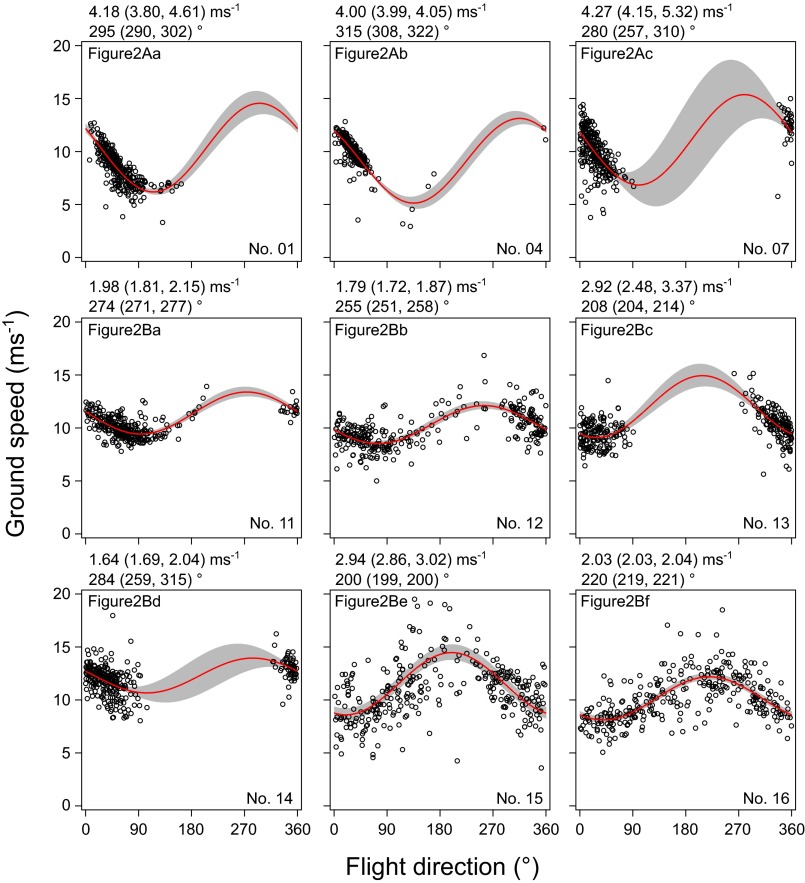
Fig. S1.
The relationship between ground speed and flight direction of streaked shearwaters in the nine points where bird-based winds and satellite-based winds were compared. Red curves are the fitted sine curves. The 95% confidence bands are shown in gray. Estimated wind speed and direction are shown above each box with estimates from lower and upper curve of the CI in parentheses. Each box is linked to the comparison points shown in Fig. 2.

